
点击进入子地图目前只实现了中国模块 数据来源,腾讯实时疫情,中国疫情网 原本只想做中国模块,后来想了想,做个世界的吧 使用axios和echarts,elementui的加载模块还有按钮,本地代理,脚手架版本4.1.1 本次不封装,刚写完还没有优化,函数名和数据名也是随便起的,大佬勿喷 npm安装即
github地址https://github.com/dmhsq/echartsMap-epidemic 体验地址 http://www.zczyp.top/ 可看完本文还有一个疫情大屏数据等着你哦 vue疫情大屏数据展示+数据导出+地图图片下载
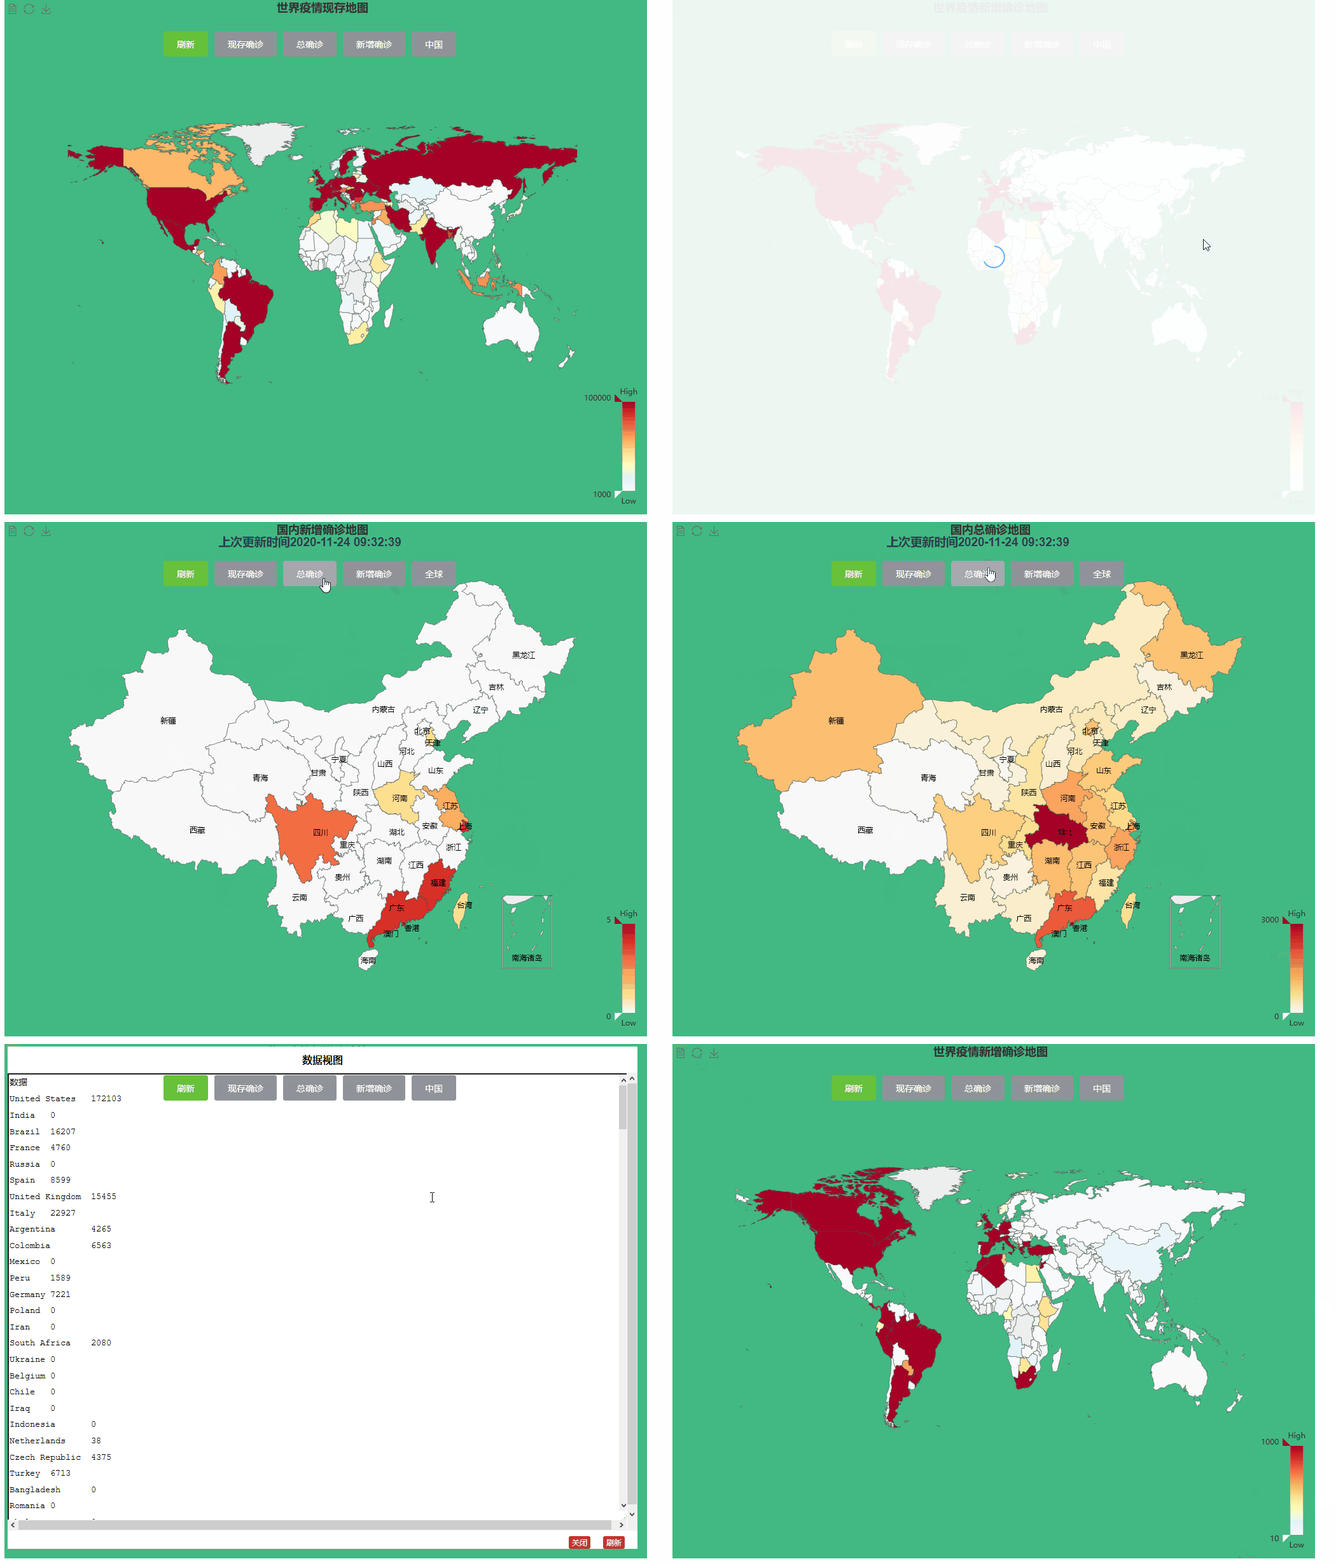
效果展示
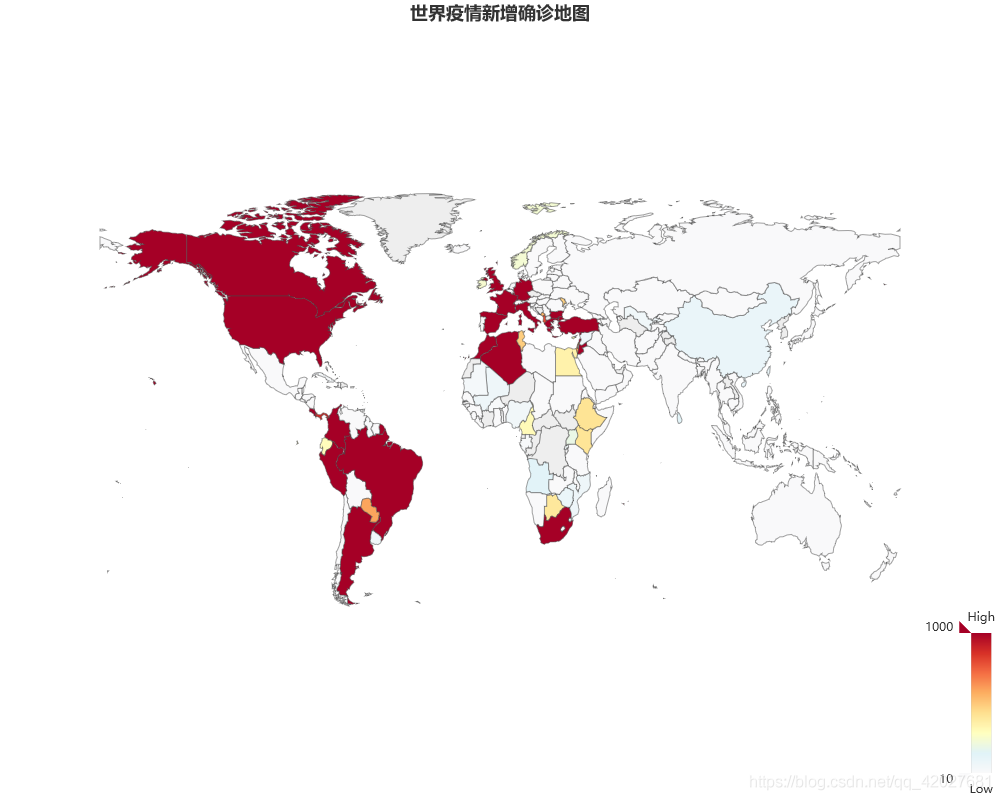
 下载的照片如下

寻找数据源
找了几家后发现中国疫情网的国内疫情数据更新的快,腾讯海外疫情也不错
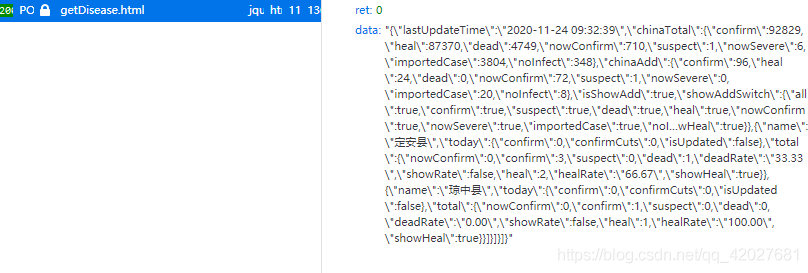
中国疫情网的数据:
这个是全国数据
 这个是按照日期

设置代理
用axios请求这些数据如果出现跨域问题,就设置本地代理,在根目录下创建vue.config.js文件
1module.exports = {
2  devServer: {
3    proxy: {
4      "/api": {
5        target: "https://www.ncovchina.com/data",
6        changeOrigin: true,
7        pathRewrite: {
8          "^/api": ""
9        }
10      },
11      "/aki": {
12        target: "http://api.fanyi.baidu.com/api/trans/vip",
13        changeOrigin: true,
14        pathRewrite: {
15          "^/aki": ""
16        }
17      }
18    },
19    host: "0.0.0.0",
20    port: 8083,
21    clientLogLevel: "info"
22  }
23};
24
api是中国疫情网数据 aki是百度翻译接口,但是本次不用,因为百度翻译标准版返回的不准,用的爱翻译的谷歌翻译
发送请求提取数据
提取数据
axios.post(/api/getDisease.html)
获得数据
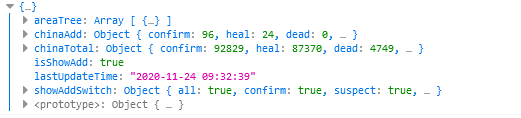
国内疫情数据获取并提取
1 this.isLoading = true;
2      axios.post(`/api/getDisease.html`).then(res => {
3        let data = JSON.parse(res.data.data);
4        console.log(data);
5        let dss = data.areaTree[0].children;
6        this.datas = dss;
7        this.chinaTotal = data.chinaTotal.confirm;
8        this.chinaAdd = data.chinaAdd.confirm;
9        this.chinaNow = data.chinaTotal.nowConfirm;
10        this.lastTime = data.lastUpdateTime;
11        this.isLoading = false;
12      });
分别提取了新增,总确诊,现存确诊 在绘制中国疫情地图时需要
axios .post( "https://api.inews.qq.com/newsqa/v1/automation/foreign/country/ranklist" ) 获取海外疫情这里获取了185个国家的数据 海外疫情数据获取并提取
1this.isLoading = true;
2      axios
3        .post(
4          "https://api.inews.qq.com/newsqa/v1/automation/foreign/country/ranklist"
5        )
6        .then(res => {
7          let data = res.data.data;
8          let names = [];
9          data.forEach(item => {
10            names.push(item.name);
11          });
12          this.worldData = data;
13          this.test(names).then(res => {
14            console.log(res.data.dst);
15            let ss = res.data.dst;
16            console.log(ss);
17            let namess = ('"' + ss.replace(/, /g, '","') + '"').split(",");
18            this.worldNames = namess;
19
20            this.setEc(this.check);
21            this.isLoading = false;
22          });
23        });
test函数封装了爱翻译的谷歌翻译,setEc是绘制地图函数
1test(content) {
2      return axios.post(
3        "http://api.aifanyi.net/google.php",
4        `content=${content}&from=zh-CN&fromtxt=中文&to=英文&totxt=英语`
5      );
6    },
为什么要这样提取数据,因为echarts地图数据是英文匹配,直接翻译即可 namess为提取翻译后的国家数组赋值给worldName worldData为海外疫情数据 names.push是提取国家名以便于翻译
踩坑
百度翻译,腾讯翻译,有道翻译会导致翻译不准数据减少,给185个国家名字,返回了174或者多点 Push会改变原格式,所有我们先push字符串再把字符串赋值给地图数据,见下面
处理数据并绘图
国内疫情地图数据处理绘制
1	  let min = 0;
2      let max = 100;
3      let title = " 地图";//地图标题(总,现存,新增)
4      let data = [];//疫情数据
5      let names = [];//提取省级名字
6      let values = [];//提取城市疫情数据
7      this.check = check;//获取选择(总,现存,新增)
8      if (check === 0) {
9        title = "国内现存确诊地图";
10        this.datas.forEach((item, index) => {
11          names.push(item.name);
12          values.push(item.total.confirm - item.total.dead - item.total.heal);
13          data.push({ name: names[index], value: values[index] });
14        });
15        min = 0;
16        max = 100;
17      }
18      if (check === 1) {
19        title = "国内总确诊地图";
20        this.datas.forEach((item, index) => {
21          names.push(item.name);
22          values.push(item.total.confirm);
23          data.push({ name: names[index], value: values[index] });
24        });
25        min = 0;
26        max = 3000;
27      }
28      if (check === 2) {
29        title = "国内新增确诊地图";
30        this.datas.forEach((item, index) => {
31          names.push(item.name);
32          values.push(item.today.confirm);
33          data.push({ name: names[index], value: values[index] });
34        });
35        min = 0;
36        max = 5;
37      }
38      echarts.registerMap("china", china);
39      let myChart = echarts.init(this.$refs.chart);
40      myChart.clear();
41      let option = {
42        title: {
43          text: title,
44          left: "center"
45        },
46        tooltip: {
47          trigger: "item",
48          showDelay: 0,
49          transitionDuration: 0.2
50        },//工具
51        visualMap: {
52          left: "right",
53          min: min,
54          max: max,
55          inRange: {
56            color: [
57              "#f9f9fa",
58              // "#bfbfc0",
59              // "#74add1",
60              // "#abd9e9",
61              // "#e0f3f8",
62              // "#ffffbf",
63              "#fee090",
64              "#fdae61",
65              "#f46d43",
66              "#d73027",
67              "#a50026"
68            ]//颜色梯度
69          },
70          text: ["High", "Low"], // 文本,默认为数值文本 见地图
71          calculable: true
72        },
73        toolbox: {
74          show: true,
75          //orient: 'vertical',
76          left: "left",
77          top: "top",
78          feature: {
79            dataView: { readOnly: false },
80            restore: {},
81            saveAsImage: {}
82          }//工具功能
83        },
84        series: [
85          {
86            name: "数据",
87            type: "map",
88            roam: true,
89            map: "china",//地图
90            emphasis: {
91              label: {
92                show: true
93              }
94            },
95            itemStyle: {
96              normal: {
97                label: {
98                  show: true//显示城市名
99                }
100              }
101            },
102            data: data
103          }
104        ]
105      };
106      myChart.setOption(option);//绘图
107      this.isChina = true;//控制地图选择是否显示
108      myChart.on("click", function(params) {
109        console.log(params);
110      });
解释
check控制选择地图类型(总,新增,现存)
min和max 还有color数组
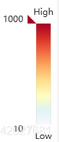 对应最大最小和颜色梯度
myChart.on("click", function(params) {
console.log(params);
});
点击地图触发事件
对应最大最小和颜色梯度
myChart.on("click", function(params) {
console.log(params);
});
点击地图触发事件
海外疫情地图数据处理绘制
1let datas = [];
2      let title = "";
3      this.isChina = false;
4      this.check = check;
5      let min = 0;
6      let max = 100;
7      echarts.registerMap("world", world);
8      let values = [];
9      if (check === 0) {
10        this.worldData.forEach((item, index) => {
11          values.push(item.nowConfirm);
12          let sss = this.worldNames[index];
13          sss = sss.substring(1, sss.length - 1);
14          if (sss === "USA") {
15            sss = "United States";
16          }
17          datas.push({
18            name: sss,
19            value: values[index]
20          });
21        });
22        datas.push({ name: "China", value: this.chinaNow });
23        title = "世界疫情现存地图";
24        min = 1000;
25        max = 100000;
26      }
27      if (check === 1) {
28        this.worldData.forEach((item, index) => {
29          values.push(item.confirm);
30          let sss = this.worldNames[index];
31          sss = sss.substring(1, sss.length - 1);
32          if (sss === "USA") {
33            sss = "United States";
34          }
35          datas.push({
36            name: sss,
37            value: values[index]
38          });
39        });
40        datas.push({ name: "China", value: this.chinaTotal });
41        title = "世界疫情总确诊地图";
42        min = 100000;
43        max = 1000000;
44      }
45      if (check === 2) {
46        this.worldData.forEach((item, index) => {
47          values.push(item.confirmAdd);
48          let sss = this.worldNames[index];
49          sss = sss.substring(1, sss.length - 1);
50          if (sss === "USA") {
51            sss = "United States";
52          }
53          datas.push({
54            name: sss,
55            value: values[index]
56          });
57        });
58        datas.push({ name: "China", value: this.chinaAdd });
59        title = "世界疫情新增确诊地图";
60        min = 10;
61        max = 1000;
62      }
63
64      let myChart = echarts.init(this.$refs.chart);
65      myChart.clear();
66      let option = {
67        title: {
68          text: title,
69          left: "center"
70        },
71        tooltip: {
72          trigger: "item",
73          showDelay: 0,
74          transitionDuration: 0.2
75        },
76        visualMap: {
77          left: "right",
78          min: min,
79          max: max,
80          inRange: {
81            color: [
82              "#f9f9fa",
83              // "#bfbfc0",
84              // "#74add1",
85              // "#abd9e9",
86              "#e0f3f8",
87              "#ffffbf",
88              "#fee090",
89              "#fdae61",
90              "#f46d43",
91              "#d73027",
92              "#a50026"
93            ]
94          },
95          text: ["High", "Low"], // 文本,默认为数值文本见地图
96          calculable: true
97        },
98        toolbox: {
99          show: true,
100          //orient: 'vertical',
101          left: "left",
102          top: "top",
103          feature: {
104            dataView: { readOnly: false },
105            restore: {},
106            saveAsImage: {}
107          }
108        },
109        series: [
110          {
111            name: "数据",
112            type: "map",
113            roam: true,
114            map: "world",
115            emphasis: {
116              label: {
117                show: true
118              }
119            },
120            itemStyle: {
121              normal: {
122                label: {
123                  show: false
124                }
125              }
126            },
127            data: datas
128          }
129        ]
130      };
131      myChart.setOption(option);
132      let vm = this;
133      myChart.on("click", function(params) {
134        console.log(params);
135        if (params.name === "China") {
136          console.log(1111);
137          vm.setEcs(vm.check);
138        }
139      });
解释参考国内的 说明 myChart.on("click", function(params) { console.log(params); if (params.name === "China") { console.log(1111); vm.setEcs(vm.check); } 进入中国地图
完整代码
1<template>
2  <div>
3    <div
4      style="background-color: #42b983;width: 1010px;height: 810px;"
5      v-loading="isLoading"
6    >
7      <div
8        style="float: left;position: relative;top:50px;left: 250px;z-index: 5"
9        v-if="!isChina"
10      >
11        <el-button type="success" @click="getworld">刷新</el-button>
12        <el-button type="info" @click="setEc(0)">现存确诊</el-button>
13        <el-button type="info" @click="setEc(1)">总确诊</el-button>
14        <el-button type="info" @click="setEc(2)">新增确诊</el-button>
15        <el-button type="info" @click="setEcs(check)">中国</el-button>
16      </div>
17      <div
18        style="float: left;position: relative;left: 250px;z-index: 5"
19        v-if="isChina"
20      >
21        <h3>上次更新时间{{ lastTime }}</h3>
22        <el-button type="success" @click="getSd">刷新</el-button>
23        <el-button type="info" @click="setEcs(0)">现存确诊</el-button>
24        <el-button type="info" @click="setEcs(1)">总确诊</el-button>
25        <el-button type="info" @click="setEcs(2)">新增确诊</el-button>
26        <el-button type="info" @click="setEc(check)">全球</el-button>
27      </div>
28      <div style="width: 1000px;height: 800px;" ref="chart"></div>
29    </div>
30  </div>
31</template>
32
33<script>
34import md5 from "js-md5";
35import echarts from "echarts";
36import china from "echarts/map/json/china.json";
37import world from "echarts/map/json/world.json";
38// import lodash from 'lodash'
39import axios from "axios";
40export default {
41  name: "echartest",
42  data() {
43    return {
44      chinaTotal: 0,
45      chinaAdd: 0,
46      chinaNow: 0,
47      datas: [],
48      worldData: [],
49      lastTime: "",
50      check: 0,
51      isLoading: false,
52      isChina: false,
53      worldNames: [],
54      worldValue: []
55    };
56  },
57  mounted() {
58    this.isLoading = true;
59    this.getSd();
60    this.getworld();
61  },
62  methods: {
63    test(content) {
64      return axios.post(
65        "http://api.aifanyi.net/google.php",
66        `content=${content}&from=zh-CN&fromtxt=中文&to=英文&totxt=英语`
67      );
68    },
69    getworld() {
70      this.isLoading = true;
71      axios
72        .post(
73          "https://api.inews.qq.com/newsqa/v1/automation/foreign/country/ranklist"
74        )
75        .then(res => {
76          let data = res.data.data;
77          let names = [];
78          data.forEach(item => {
79            names.push(item.name);
80          });
81          this.worldData = data;
82          this.test(names).then(res => {
83            console.log(res.data.dst);
84            let ss = res.data.dst;
85            console.log(ss);
86            let namess = ('"' + ss.replace(/, /g, '","') + '"').split(",");
87            this.worldNames = namess;
88
89            this.setEc(this.check);
90            this.isLoading = false;
91          });
92        });
93    },
94    getSd() {
95      this.isLoading = true;
96      axios.post(`/api/getDisease.html`).then(res => {
97        let data = JSON.parse(res.data.data);
98        console.log(data);
99        let dss = data.areaTree[0].children;
100        this.datas = dss;
101        this.chinaTotal = data.chinaTotal.confirm;
102        this.chinaAdd = data.chinaAdd.confirm;
103        this.chinaNow = data.chinaTotal.nowConfirm;
104        this.lastTime = data.lastUpdateTime;
105        this.isLoading = false;
106      });
107    },
108    setEcs(check) {
109      let min = 0;
110      let max = 100;
111      let title = " 地图";
112      let data = [];
113      let names = [];
114      let values = [];
115      this.check = check;
116      if (check === 0) {
117        title = "国内现存确诊地图";
118        this.datas.forEach((item, index) => {
119          names.push(item.name);
120          values.push(item.total.confirm - item.total.dead - item.total.heal);
121          data.push({ name: names[index], value: values[index] });
122        });
123        min = 0;
124        max = 100;
125      }
126      if (check === 1) {
127        title = "国内总确诊地图";
128        this.datas.forEach((item, index) => {
129          names.push(item.name);
130          values.push(item.total.confirm);
131          data.push({ name: names[index], value: values[index] });
132        });
133        min = 0;
134        max = 3000;
135      }
136      if (check === 2) {
137        title = "国内新增确诊地图";
138        this.datas.forEach((item, index) => {
139          names.push(item.name);
140          values.push(item.today.confirm);
141          data.push({ name: names[index], value: values[index] });
142        });
143        min = 0;
144        max = 5;
145      }
146      echarts.registerMap("china", china);
147      let myChart = echarts.init(this.$refs.chart);
148      myChart.clear();
149      let option = {
150        title: {
151          text: title,
152          left: "center"
153        },
154        tooltip: {
155          trigger: "item",
156          showDelay: 0,
157          transitionDuration: 0.2
158        },
159        visualMap: {
160          left: "right",
161          min: min,
162          max: max,
163          inRange: {
164            color: [
165              "#f9f9fa",
166              // "#bfbfc0",
167              // "#74add1",
168              // "#abd9e9",
169              // "#e0f3f8",
170              // "#ffffbf",
171              "#fee090",
172              "#fdae61",
173              "#f46d43",
174              "#d73027",
175              "#a50026"
176            ]
177          },
178          text: ["High", "Low"], // 文本,默认为数值文本
179          calculable: true
180        },
181        toolbox: {
182          show: true,
183          //orient: 'vertical',
184          left: "left",
185          top: "top",
186          feature: {
187            dataView: { readOnly: false },
188            restore: {},
189            saveAsImage: {}
190          }
191        },
192        series: [
193          {
194            name: "数据",
195            type: "map",
196            roam: true,
197            map: "china",
198            emphasis: {
199              label: {
200                show: true
201              }
202            },
203            itemStyle: {
204              normal: {
205                label: {
206                  show: true
207                }
208              }
209            },
210            // 文本位置修正
211
212            data: data
213          }
214        ]
215      };
216      myChart.setOption(option);
217      this.isChina = true;
218      myChart.on("click", function(params) {
219        console.log(params);
220      });
221    },
222    setEc(check) {
223      let datas = [];
224      let title = "";
225      this.isChina = false;
226      this.check = check;
227      let min = 0;
228      let max = 100;
229      echarts.registerMap("world", world);
230      let values = [];
231      if (check === 0) {
232        this.worldData.forEach((item, index) => {
233          values.push(item.nowConfirm);
234          let sss = this.worldNames[index];
235          sss = sss.substring(1, sss.length - 1);
236          if (sss === "USA") {
237            sss = "United States";
238          }
239          datas.push({
240            name: sss,
241            value: values[index]
242          });
243        });
244        datas.push({ name: "China", value: this.chinaNow });
245        title = "世界疫情现存地图";
246        min = 1000;
247        max = 100000;
248      }
249      if (check === 1) {
250        this.worldData.forEach((item, index) => {
251          values.push(item.confirm);
252          let sss = this.worldNames[index];
253          sss = sss.substring(1, sss.length - 1);
254          if (sss === "USA") {
255            sss = "United States";
256          }
257          datas.push({
258            name: sss,
259            value: values[index]
260          });
261        });
262        datas.push({ name: "China", value: this.chinaTotal });
263        title = "世界疫情总确诊地图";
264        min = 100000;
265        max = 1000000;
266      }
267      if (check === 2) {
268        this.worldData.forEach((item, index) => {
269          values.push(item.confirmAdd);
270          let sss = this.worldNames[index];
271          sss = sss.substring(1, sss.length - 1);
272          if (sss === "USA") {
273            sss = "United States";
274          }
275          datas.push({
276            name: sss,
277            value: values[index]
278          });
279        });
280        datas.push({ name: "China", value: this.chinaAdd });
281        title = "世界疫情新增确诊地图";
282        min = 10;
283        max = 1000;
284      }
285
286      let myChart = echarts.init(this.$refs.chart);
287      myChart.clear();
288      let option = {
289        title: {
290          text: title,
291          left: "center"
292        },
293        tooltip: {
294          trigger: "item",
295          showDelay: 0,
296          transitionDuration: 0.2
297        },
298        visualMap: {
299          left: "right",
300          min: min,
301          max: max,
302          inRange: {
303            color: [
304              "#f9f9fa",
305              // "#bfbfc0",
306              // "#74add1",
307              // "#abd9e9",
308              "#e0f3f8",
309              "#ffffbf",
310              "#fee090",
311              "#fdae61",
312              "#f46d43",
313              "#d73027",
314              "#a50026"
315            ]
316          },
317          text: ["High", "Low"], // 文本,默认为数值文本
318          calculable: true
319        },
320        toolbox: {
321          show: true,
322          //orient: 'vertical',
323          left: "left",
324          top: "top",
325          feature: {
326            dataView: { readOnly: false },
327            restore: {},
328            saveAsImage: {}
329          }
330        },
331        series: [
332          {
333            name: "数据",
334            type: "map",
335            roam: true,
336            map: "world",
337            emphasis: {
338              label: {
339                show: true
340              }
341            },
342            itemStyle: {
343              normal: {
344                label: {
345                  show: false
346                }
347              }
348            },
349            // 文本位置修正
350
351            data: datas
352          }
353        ]
354      };
355      myChart.setOption(option);
356      let vm = this;
357      myChart.on("click", function(params) {
358        console.log(params);
359        if (params.name === "China") {
360          console.log(1111);
361          vm.setEcs(vm.check);
362        }
363      });
364    },
365
366  }
367};
368</script>
369
370<style scoped></style>
371
代码优化
可以优化重复的比如check选择那一块,绘制也可以优化,优化的地方还有很多,这里只讲实现
<br><br><br><br>
大家好,我是代码哈士奇,是一名软件学院网络工程的学生,因为我是“狗”,狗走千里吃肉。想把大学期间学的东西和大家分享,和大家一起进步。但由于水平有限,博客中难免会有一些错误出现,有纰漏之处恳请各位大佬不吝赐教!暂时只在csdn这一个平台进行更新,博客主页:https://blog.csdn.net/qq_42027681。
未经本人允许,禁止转载

后续会推出
前端:vue入门 vue开发小程序 等 后端: java入门 springboot入门等 服务器:mysql入门 服务器简单指令 云服务器运行项目 一些插件的使用等
大学之道亦在自身,努力学习,热血青春 如果对编程感兴趣可以加入我们的qq群一起交流:974178910
有问题可以下方留言,看到了会回复哦