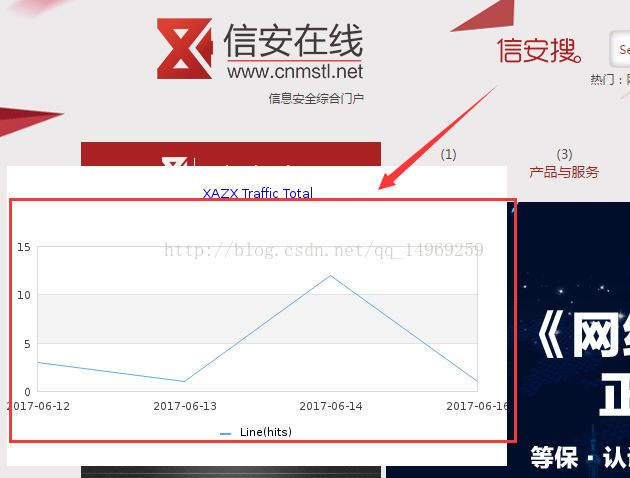
公司最近要求开发网站点击量统计的功能,使用折线图显示出来。通过查阅资料发现jpgraph是很方便、强大的制作图表工具。
下载地址:http://jpgraph.net/
1、先要保证PHP打开了Gd2的扩展:
打开PHP.ini,定位到extension=php_gd2.dll,把前面的分号删掉。
2、如果出现以下错误:
strtotime(): It is not safe to rely on the system’s timezone settings
请不要慌张,打开php.ini文件输入以下内容:
date.timezone = “Asia/Shanghai”
重启apache即可。
步骤:
一、把下载的jpgraph包放到自己的项目中
二、折线图代码读取数据库
<?php /\*\* \* Created by PhpStorm. \* User: liang \* Date: 2017/6/5 \* Time: 14:23 \*/ $servername = "localhost"; $username = "root"; $password = "root"; $dbname = "\*\*\*\*\*\*"; // 创建连接 $conn = mysqli\_connect($servername, $username, $password,$dbname); // 检测连接 if (!$conn) { die("Connection failed: " . mysqli\_connect\_error()); } $title = $\_REQUEST\['url'\]; $sql = "select \*,count(\*) as hit, FROM\_UNIXTIME(addtime,'%Y-%m-%d') as e from cnmstl\_artmodule\_hits where FROM\_UNIXTIME(addtime) >= date\_sub(curdate(), INTERVAL 7 DAY) and title = '$title' group by e"; //获取某个模块最近7天的点击量 $result = $conn->query($sql); while($row = $result->fetch\_assoc()) { $value = $row\['hit'\]; $value\_y\[\]=$value; $value\_x\[\] = $row\['e'\];//x轴坐标名称 // print\_r($value); } $conn->close(); \------------------------------------------------------------------------------------------------- 折线图类 <?php include ("jpgraph.php"); include ("jpgraph\_line.php"); //将要用于图表创建的数据存放在数组中 //$data = array(19,23,34,38,45,67,71,78,85,90,96,145); //print\_r("$value\_y"); $data = $value\_y; $graph = new Graph(500,300); //创建新的Graph对象 $graph->SetScale("textlin"); //设置刻度样式 $graph->img->SetMargin(30,30,80,30); //设置图表边界 $graph->title->Set("XAZX Traffic Total"); //设置图表标题 $graph->title->SetColor("blue"); $graph->title->SetMargin(20); // Create the linear plot $lineplot=new LinePlot($data); // 创建新的LinePlot对象 $lineplot->SetLegend("Line(hits)"); //设置图例文字 $lineplot->SetColor("red"); // 设置曲线的颜色 //设置x、y轴名称 //$x = array('jan','feb','mar','asdfa','asdfa'); //$y = array(1,3,4,5,6,7); $x = $value\_x; $graph->xaxis->SetTickLabels($x); //$graph->xaxis->SetFont(FF\_SIMSUN,FS\_BOLD); //$graph->yaxis->SetTickLabels($y);//经过测试y轴的无效 //$graph->yaxis->SetFont(FF\_SIMSUN,FS\_BOLD); // Add the plot to the graph $graph->Add($lineplot); //在统计图上绘制曲线 // Display the graph $graph->Stroke(); //输出图像 三、效果