
Netty流量统计
netty专门提供了一个traffic包用于流量的统计,如下图所示:
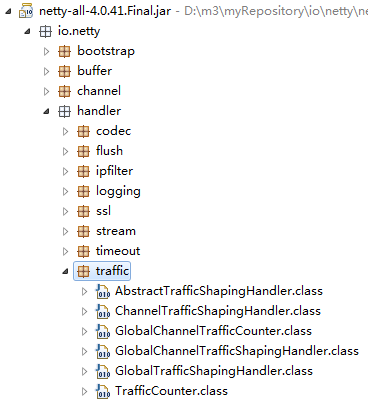
分别提供了全局的GlobalTrafficShapingHandler和针对channel的ChannelTrafficShapingHandler,同时提供了TrafficCounter用来记录实时的流量统计。
简单的使用:
1ChannelPipeline p = socketChannel.pipeline();
2p.addLast(new GlobalTrafficShapingHandler(Executors.newScheduledThreadPool(1), 1000));
GlobalTrafficShapingHandler提供的方法trafficCounter()可以用来获取TrafficCounter对象,
TrafficCounter提供了常用的一些方法:
1/**
2     * @return the Read Throughput in bytes/s computes in the last check interval.
3     */
4    public long lastReadThroughput() {
5        return lastReadThroughput;
6    }
7
8    /**
9     * @return the Write Throughput in bytes/s computes in the last check interval.
10     */
11    public long lastWriteThroughput() {
12        return lastWriteThroughput;
13    }
14
15    /**
16     * @return the number of bytes read during the last check Interval.
17     */
18    public long lastReadBytes() {
19        return lastReadBytes;
20    }
21
22    /**
23     * @return the number of bytes written during the last check Interval.
24     */
25    public long lastWrittenBytes() {
26        return lastWrittenBytes;
27    }
28
29    /**
30     * @return the current number of bytes read since the last checkInterval.
31     */
32    public long currentReadBytes() {
33        return currentReadBytes.get();
34    }
35
36    /**
37     * @return the current number of bytes written since the last check Interval.
38     */
39    public long currentWrittenBytes() {
40        return currentWrittenBytes.get();
41    }
42
43    /**
44     * @return the Time in millisecond of the last check as of System.currentTimeMillis().
45     */
46    public long lastTime() {
47        return lastTime.get();
48    }
49
50    /**
51     * @return the cumulativeWrittenBytes
52     */
53    public long cumulativeWrittenBytes() {
54        return cumulativeWrittenBytes.get();
55    }
56
57    /**
58     * @return the cumulativeReadBytes
59     */
60    public long cumulativeReadBytes() {
61        return cumulativeReadBytes.get();
62    }
63
64    /**
65     * @return the lastCumulativeTime in millisecond as of System.currentTimeMillis()
66     * when the cumulative counters were reset to 0.
67     */
68    public long lastCumulativeTime() {
69        return lastCumulativeTime;
70    }
71
72    /**
73     * @return the realWrittenBytes
74     */
75    public AtomicLong getRealWrittenBytes() {
76        return realWrittenBytes;
77    }
78
79    /**
80     * @return the realWriteThroughput
81     */
82    public long getRealWriteThroughput() {
83        return realWriteThroughput;
84    }
JMX的MBean
JMX即Java Management Extensions(Java管理扩展),MBean即Managed Beans(被管理的Beans)
一个MBean是一个被管理的Java对象,有点类似于JavaBean,一个设备、一个应用或者任何资源都可以被表示为MBean,MBean会暴露一个接口对外,这个接口可以读取或者写入一些对象中的属性,通常一个MBean需要定义一个接口,以MBean结尾,如下面用于统计netty的流量的MBean:
1public interface IoAcceptorStatMBean {
2
3    public long getWrittenBytesThroughput();
4
5    public long getReadBytesThroughput();
6}
MBean的实现:
1public class IoAcceptorStat implements IoAcceptorStatMBean {
2
3    @Override
4    public long getWrittenBytesThroughput() {
5        return SocksServer.getInstance().getTrafficCounter()
6                .lastWriteThroughput();
7    }
8
9    @Override
10    public long getReadBytesThroughput() {
11        return SocksServer.getInstance().getTrafficCounter()
12                .lastReadThroughput();
13    }
14
15}
下面需要将我们定义的MBean被管理起来
1MBeanServer mBeanServer = ManagementFactory.getPlatformMBeanServer();
2IoAcceptorStat mbean = new IoAcceptorStat();
3
4try {
5     ObjectName acceptorName = new ObjectName(mbean.getClass().getPackage().getName()
6                 + ":type=IoAcceptorStat");
7     mBeanServer.registerMBean(mbean, acceptorName);
8} catch (Exception e) {
9     e.printStackTrace();
10}
1.向ManagementFactory申请了一个MBeanServer对象
2.给定一个标识ObjectName,使用了(包名:type=类名)的形式
3.通过registerMBean方法注册了mbean,并且使用ObjectName作为标识
接下来就可以使用JDK自带工具jconsole来查看MBean了
监控netty的流量
以上的代码是项目shadowsocks-netty中的部分代码,shadowsocks-netty是一个基于netty实现的shadowsocks的客户端,
更多介绍:https://my.oschina.net/OutOfMemory/blog/744475
github:https://github.com/ksfzhaohui/shadowsocks-netty
启动shadowsocks-netty程序,使用jconsole进行连接,并打开YouTube随便打开一个视频,切换到Jconsole的MBean页签就可以实时监控了
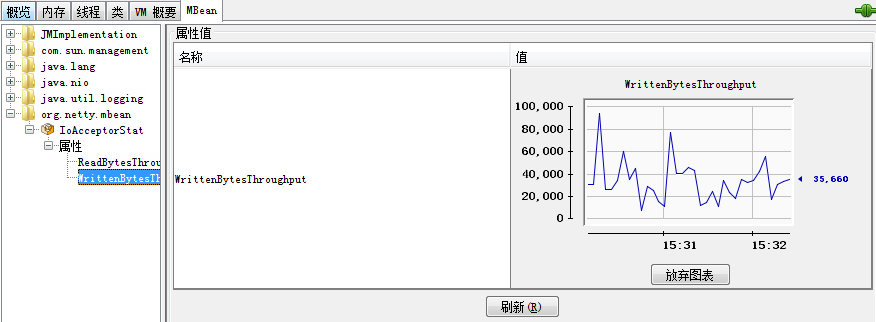
监控的代理程序的写速度,其实就是浏览器下载数据的速度
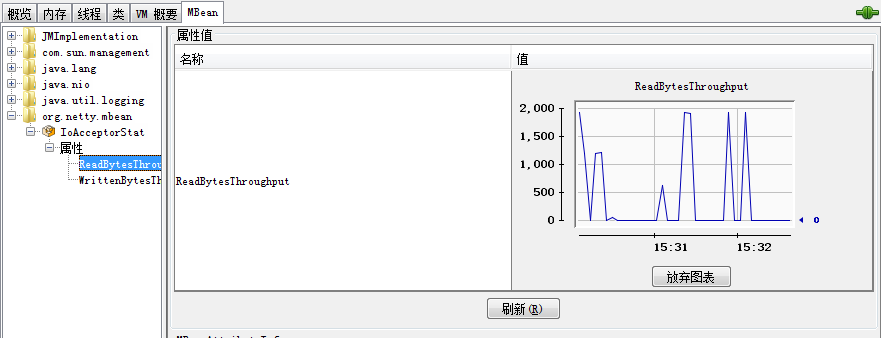
监控的代理程序的读速度,其实就是浏览器的上传速度
总结
在开发阶段对应用流量的监控还是很有必要的,可以大概估算应用的带宽,同时方便我们查看是否达到指定的标准
个人博客:codingo.xyz