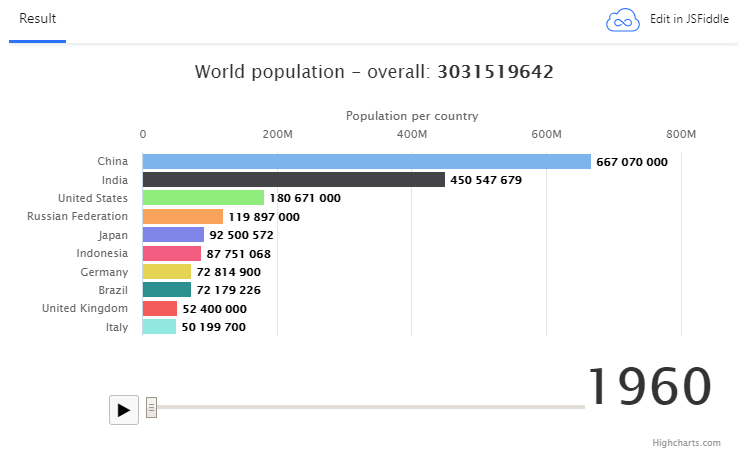
您听说过条形图比赛吗?没有?嗯,这不是数据科学家的棋盘游戏,但实际上是一种通过动画以条形图格式显示时间序列的有用方法。
这是一个示例,下面我们将展示如何创建此图表。
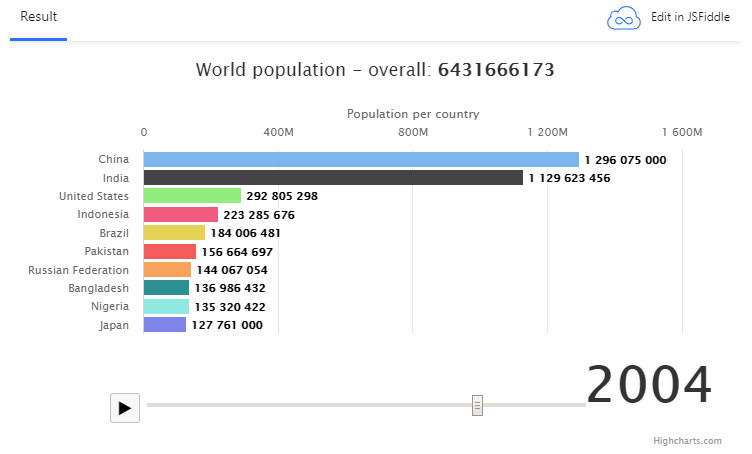
借助dataSorting功能,使用Highcharts库创建条形图竞赛非常容易和直接。在本教程中,我们将向您展示如何创建世界人口条形图竞赛。
让我们开始吧!
本教程中使用的数据是1960年至2018年的世界人口。这是此演示中使用的数据的链接。现在,我们有了数据;让我们做一个处理特定年份数据的函数。
/** * Calculate the data output */ function getData(year) { let output = initialData.map(data => { return [data["Country Name"], data[year]] }).sort((a, b) => b[1] - a[1]); return ([output[0], output.slice(1, 11)]); }
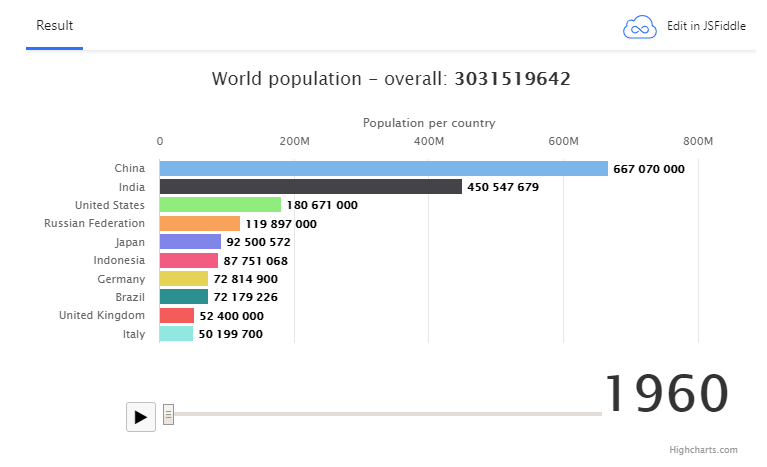
该演示中的第一个结果显示了与1960年有关的数据:
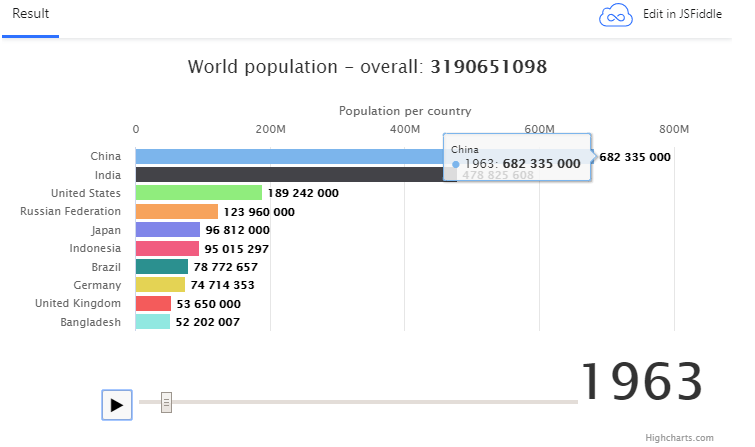
下一步是向图表添加动画。为此,我们需要添加以下HTML元素:播放/停止按钮和用于交互式进度栏的元素type=”range”。我们还必须添加样式效果!(请参见下面的CSS):
@import "https://maxcdn.bootstrapcdn.com/font-awesome/4.3.0/css/font-awesome.min.css"; #parentContainer { min-width: 400px; max-width: 800px; } #play-controls { position: absolute; left: 100px; top: 350px; } #play-pause-button { width: 30px; height: 30px; cursor: pointer; border: 1px solid silver; border-radius: 3px; background: #f8f8f8; } #play-range { transform: translateY(2.5px); }
我们将在窗口调整大小后添加此功能以适应范围宽度:
events: { render() { let chart = this;
1 // Responsive input
2 input.style.width = chart.plotWidth - chart.legend.legendWidth + 'px'
} },
先前更改的结果在此演示中:
到目前为止,我们有一个按钮和一个范围栏元素,让我们创建按钮的功能以使用该series.update功能更新图表:
/** * Update the chart. This happens either on updating (moving) the range input, * or from a timer when the timeline is playing. */ function update(increment) { if (increment) { input.value = parseInt(input.value) + increment; } if (input.value >= endYear) { // Auto-pause pause(btn); }
chart.update({ title: { useHTML: true, text: `
World population - overall: ${getData(input.value)[0][1]}
`: `
World population - overall: ${getData(input.value)[0][1]}
********` },}, }, false, false, false)}, false, false, false) chart.series[0].update({.series[0].update({ name: input.value,: input.value, data: getData(input.value)[1]: getData(input.value)[1] })}) }}********在这里,我们将上面的功能链接到按钮元素:
**/** * Play the timeline. */ function play(button) {function play(button) { button.title = 'pause';.title = 'pause'; button.className = 'fa fa-pause';.className = 'fa fa-pause'; chart.sequenceTimer = setInterval(function() {.sequenceTimer = setInterval(function() { update(1);(1); }, 500);}, 500); }}
/** /** * Pause the timeline, either when the range is ended, or when clicking the pause button. * Pausing stops the timer and resets the button to play mode. */ function pause(button) {function pause(button) { button.title = 'play';.title = 'play'; button.className = 'fa fa-play';.className = 'fa fa-play'; clearTimeout(chart.sequenceTimer);(chart.sequenceTimer); chart.sequenceTimer = undefined;.sequenceTimer = undefined; }}
btn.addEventListener('click', function() {.addEventListener('click', function() { if (chart.sequenceTimer) {if (chart.sequenceTimer) { pause(this)(this) } else {} else { play(this)(this) }} })})
/** /** * Trigger the update on the range bar click. */ input.addEventListener('click', function() {.addEventListener('click', function() { update()() })})**
现在,我们有一个完全正常工作的种族条形图:
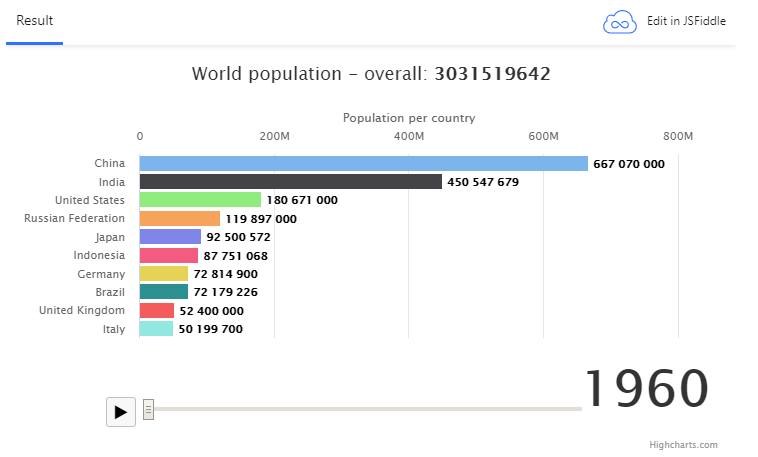
最后一步,我们可以附加一个自定义功能来调整数据标签的更改效果:
**/** * Animate dataLabels functionality */ (function(H) {(function(H) { const FLOAT = /^-?\d+\.?\d*$/;const FLOAT = /^-?\d+\.?\d*$/; // Add animated textSetter, just like fill/strokeSetters// Add animated textSetter, just like fill/strokeSetters H.Fx.prototype.textSetter = function(proceed) {.Fx.prototype.textSetter = function(proceed) { var startValue = this.start.replace(/ /g, ''),var startValue = this.start.replace(/ /g, ''), endValue = this.end.replace(/ /g, ''),= this.end.replace(/ /g, ''), currentValue = this.end.replace(/ /g, '');= this.end.replace(/ /g, ''); if ((startValue || '').match(FLOAT)) {if ((startValue || '').match(FLOAT)) { startValue = parseInt(startValue, 10);= parseInt(startValue, 10); endValue = parseInt(endValue, 10);
1  // No support for float
2  currentValue = Highcharts.numberFormat(
3    Math.round(startValue + (endValue - startValue) \* this.pos), 0);
4}
5this.elem.endText = this.end;
6this.elem.attr(
7  this.prop,
8  currentValue,
9  null,
10  true
11);
};
// Add textGetter, not supported at all at this moment: H.SVGElement.prototype.textGetter = function(hash, elem) { var ct = this.text.element.textContent || ''; return this.endText ? this.endText : ct.substring(0, ct.length / 2); }
// Temporary change label.attr() with label.animate(): // In core it's simple change attr(...) => animate(...) for text prop H.wrap(H.Series.prototype, 'drawDataLabels', function(proceed) { var ret, attr = H.SVGElement.prototype.attr, chart = this.chart;
1if (chart.sequenceTimer) {
2  this.points.forEach(
3    point => (point.dataLabels || \[\]).forEach(
4      label => label.attr = function(hash, val) {
5        if (hash && hash.text !== undefined) {
6          var text = hash.text;
7          delete hash.text;
8          this.attr(hash);
9          this.animate({
10            text: text
11          });
12          return this;
13        } else {
14          return attr.apply(this, arguments);
15        }
16      }
17    )
18  );
19}
20ret = proceed.apply(this, Array.prototype.slice.call(arguments, 1));
21this.points.forEach(
22  p => (p.dataLabels || \[\]).forEach(d => d.attr = attr)
23);
24return ret;
}); })(Highcharts);**
最终结果在下面的演示中: