
一、部署prometheus,grafana和node_exporter
Prometheus开始教程:https://github.com/Alrights/prometheus/blob/master/introductions/FirstSteps.md
1.1 环境(centos7)
1[root@localhost prometheus]# uname -a
2Linux localhost.localdomain 3.10.0-957.10.1.el7.x86_64 #1 SMP Mon Mar 18 15:06:45 UTC 2019 x86_64 x86_64 x86_64 GNU/Linux
1.2 环境部署与服务启动
1// 安装prometheus
2wget  https://github.com/prometheus/prometheus/releases/download/v2.9.2/prometheus-2.9.2.linux-amd64.tar.gz
3tar xzvf prometheus-2.9.2.linux-amd64.tar.gz
4mv prometheus-2.9.2.linux-amd64 /usr/local/prometheus
// 添加prometheus用户,非必须 groupadd prometheus useradd -g prometheus -m -d /var/lib/prometheus -s /sbin/nologin prometheus
1
2对systemctl不熟的可以了解[鸟哥的Linux私房菜](https://links.jianshu.com/go?to=http%3A%2F%2Flinux.vbird.org%2Flinux_basic%2F0560daemons.php%23daemon)
3
// prometheus系统服务配置 vim /etc/systemd/system/prometheus.service
[Unit] Description=prometheus After=network.target [Service] Type=simple User=prometheus ExecStart=/usr/local/prometheus/prometheus -config.file=/usr/local/prometheus/prometheus.yml -storage.local.path=/var/lib/prometheus Restart=on-failure [Install] WantedBy=multi-user.target
1// 启动prometheus 2systemctl start prometheus 3systemctl status prometheus 4``` 5 6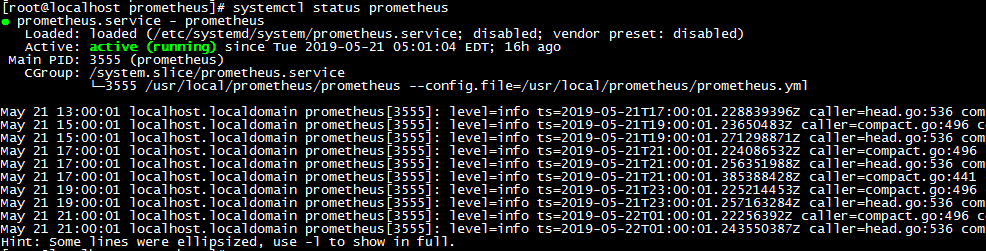 7 8systemctl\_prometheus.png 9 102. node\_exporter setup 11 12``` 13// 安装node_exporter 14wget https://github.com/prometheus/node_exporter/releases/download/v0.18.0/node_exporter-0.18.0.linux-amd64.tar.gz 15tar -zxvf node_exporter-0.18.0.linux-amd64.tar.gz 16mv node_exporter-0.18.0.linux-amd64 /usr/local/node_exporter
// 系统服务配置node_exporter vim /etc/systemd/system/node_exporter.service
[Unit] Description=node_exporter After=network.target [Service] Type=simple User=prometheus ExecStart=/usr/local/node_exporter/node_exporter Restart=on-failure [Install] WantedBy=multi-user.target
1systemctl start node_exporter 2systemctl status node_exporter 3``` 4 5 6 7systemctl\_node\_exporter.png 8 93. add node\_exporter to prometheus.yaml 10 11``` 12vim /usr/local/prometheus/prometheus.yml 13 14 - job_name: 'linux' 15 static_configs: 16 - targets: ['localhost:9100'] 17 labels: 18 instance: node1
systemctl restart prometheus systemctl status prometheus
1
24.  grafana setup
3
// 安装grafana wget https://dl.grafana.com/oss/release/grafana-6.1.6-1.x86_64.rpm yum localinstall grafana-6.1.6-1.x86_64.rpm // 启动grafana-server systemctl start grafana-server systemctl status grafana-server
1 2 3 4systemctl\_grafana\_server.png 5 6二、仪表化 7----- 8 9### 2.1 prometheus 10 11prometheus默认端口为9090,可以在浏览器中输入[http://localhost:9090/](https://links.jianshu.com/go?to=http%3A%2F%2Flocalhost%3A9090%2F) 12 13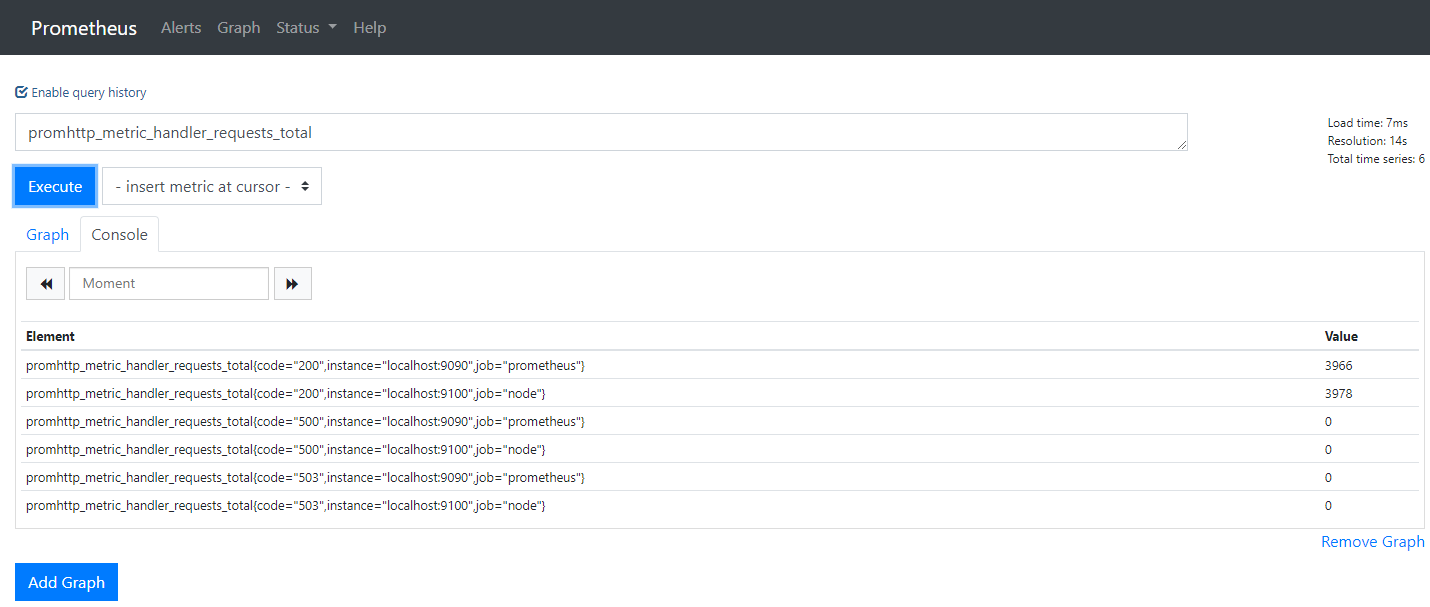 14 15prometheus\_first\_start.png 16 17### 2.2 granafa 18 19granafa默认端口为3000,可以在浏览器中输入[http://localhost:3000/](https://links.jianshu.com/go?to=http%3A%2F%2Flocalhost%3A3000%2F) 20 21* granafa首次登录账户名和密码`admin/admin`,可以修改 22* 配置数据源`Data sources->Add data source -> Prometheus`,输入prometheus数据源的信息,主要是输入`name`和`url` 23 24 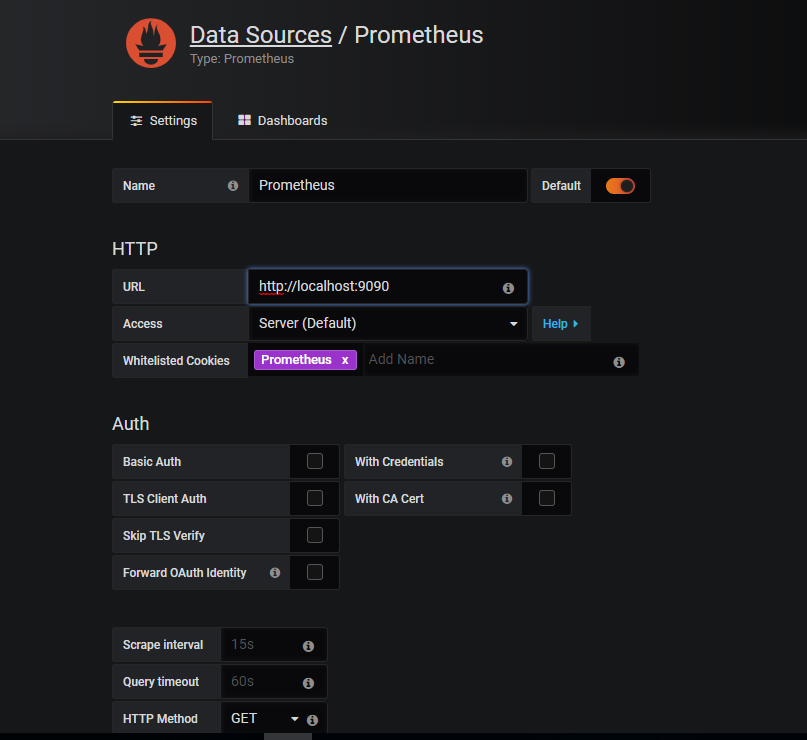 25 26 grafana\_prometheus\_datasource.png 27 28* 添加Dashboard`New Dashboard->Import Dashboard->输入8919`,配置数据源为Prometheus,即上一步中的`name` 29 30 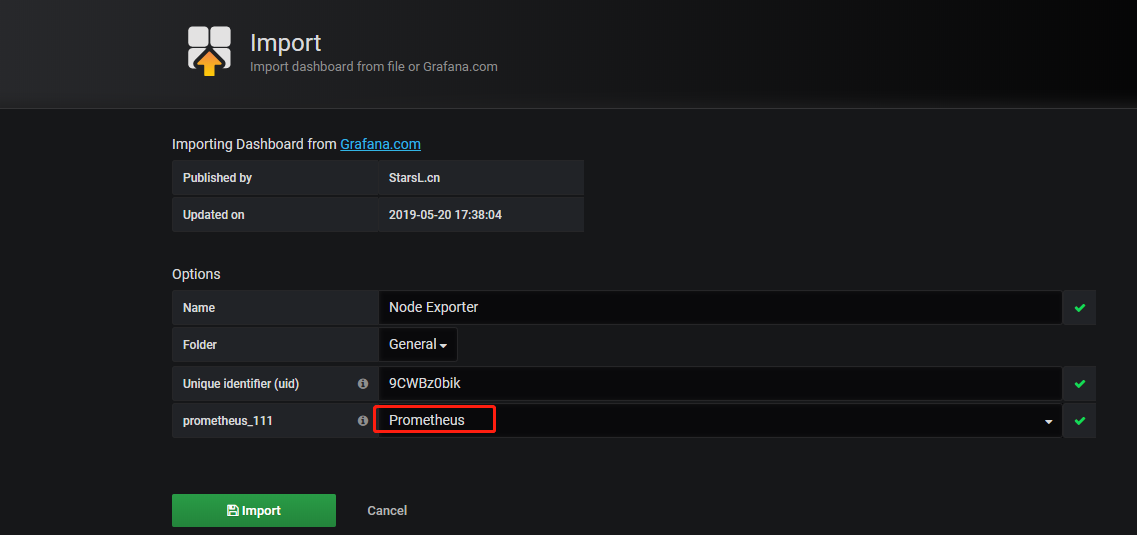 31 32 grafana\_dashboard\_node\_exporter.png 33 34* 配置完保存后即可看到逼格非常高的系统主机节点监控信息,包括CPU、IO、网络等信息。 35 36 37 38 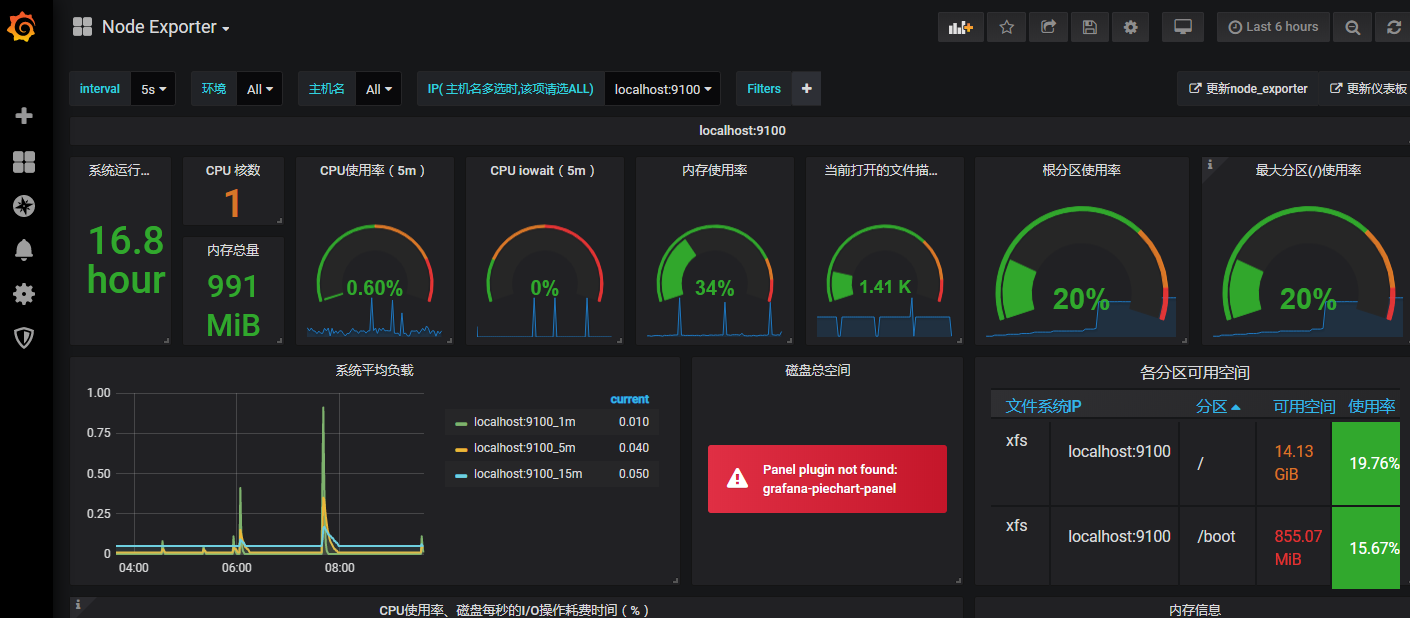 39 40 grafana\_first\_dashboard.png 41 42 43三、tips 44------ 45 461. iptables(端口不通) 47
/sbin/iptables -I INPUT -p tcp --dport 9090 -j ACCEPT
1
22.  datetime(设置时区)
3
timedatectl list-timezones timedatectl set-timezone Asia/Shanghai
1
2
3
4本文转自 [https://www.jianshu.com/p/65fcff832ad7](https://www.jianshu.com/p/65fcff832ad7),如有侵权,请联系删除。