
Filebeat快速入门
本笔记整理于https://www.elastic.co/guide/en/beats/filebeat/current/filebeat-installation.html,仅做个人学习总结使用。 Filebeat是轻量级日志采集工具,经常与ELK搭配使用,作为数据采集源头使用。
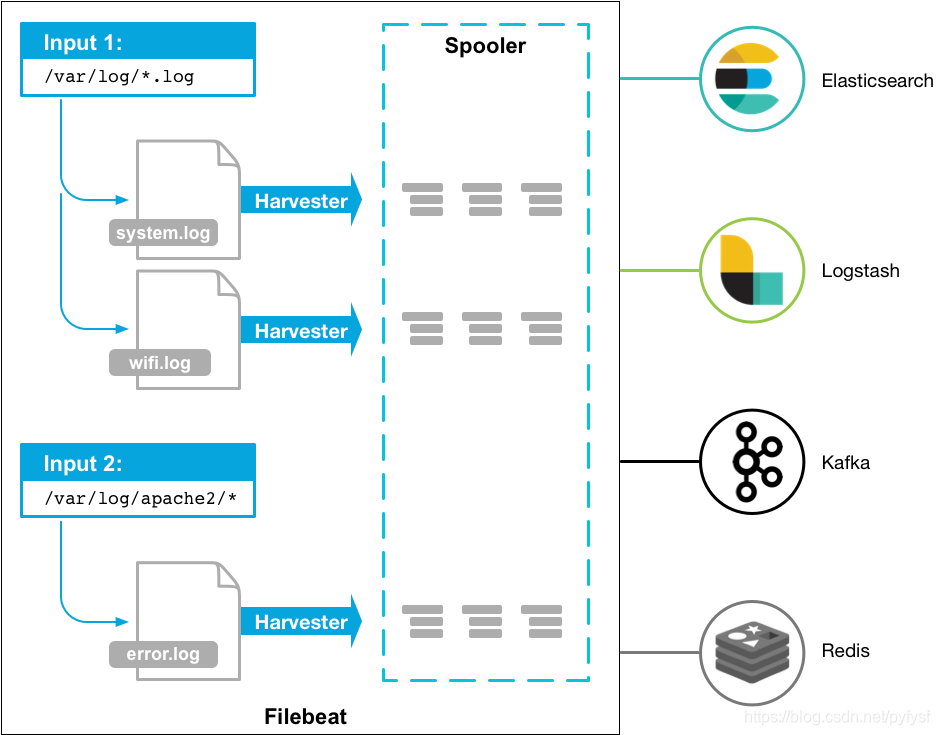
filebeat使用示意图
安装部署
Centos7(作者使用)
由于下载太慢了,所以我这里保存了一个下载好的版本(filebeat-6.3.2-linux-x86_64.tar),如果使用请自取:https://quqi.gblhgk.com/s/1727102/vafFOSOsw5AXKP3d
上传到服务器,解压即可
deb(未尝试):
1    curl -L -O https://artifacts.elastic.co/downloads/beats/filebeat/filebeat-7.6.1-amd64.deb
2    sudo dpkg -i filebeat-7.6.1-amd64.deb
rpm(未尝试):
1curl -L -O https://artifacts.elastic.co/downloads/beats/filebeat/filebeat-7.6.1-x86_64.rpm
2sudo rpm -vi filebeat-7.6.1-x86_64.rpm
mac(未尝试):
1curl -L -O https://artifacts.elastic.co/downloads/beats/filebeat/filebeat-7.6.1-darwin-x86_64.tar.gz
2tar xzvf filebeat-7.6.1-darwin-x86_64.tar.gz
linux(未尝试):
1curl -L -O https://artifacts.elastic.co/downloads/beats/filebeat/filebeat-7.6.1-linux-x86_64.tar.gz
2tar xzvf filebeat-7.6.1-linux-x86_64.tar.gz
Windows(未尝试):
-
下载 https://download.elastic.co/beats/filebeat/filebeat-5.0.0-windows.zip
-
解压到 C:\Program Files
-
重命名 filebeat-5.0.0-windows 目录为 Filebeat
-
右键点击 PowerSHell 图标,选择『以管理员身份运行』
-
运行下列命令,将 Filebeat 安装成 windows 服务:
1PS > cd 'C:\Program Files\Filebeat'
2PS C:\Program Files\Filebeat> .\install-service-filebeat.ps1
注意 可能需要额外授予执行权限。命令为:PowerShell.exe -ExecutionPolicy RemoteSigned -File .\install-service-filebeat.ps1
快速使用
<font color='red'>作者环境:centos7、JDK8、filebeat-6.3.2、logstash-6.5.1</font>
filebeat.yml配置
修改filebeat.yml配置文件,主要修改节点【filebeat.inputs、 paths、 include_lines、name、(output.logstash)】
按需修改,我这里配置filebeat需要监听【 /shaofei/logs】文件夹下后缀为[.log]的文件,监听的关键字是【'Exception','用户登录异常'】, 注意: 如果需要监听中文,需要保证文件编码为UTF-8。或者使用【encoding】指定所监听的文件编码 我配置了name: 为"study128",我这里使用Logstash作为它的输出端【 Logstash output 】,即使没有接收端来接收filebeat输出的日志也不会影响filebeat的启动 修改配置文件的时候一定要注意yml的格式
1###################### Filebeat Configuration Example #########################
2
3# This file is an example configuration file highlighting only the most common
4# options. The filebeat.reference.yml file from the same directory contains all the
5# supported options with more comments. You can use it as a reference.
6#
7# You can find the full configuration reference here:
8# https://www.elastic.co/guide/en/beats/filebeat/index.html
9
10# For more available modules and options, please see the filebeat.reference.yml sample
11# configuration file.
12
13#=========================== Filebeat inputs =============================
14
15filebeat.inputs:
16
17# Each - is an input. Most options can be set at the input level, so
18# you can use different inputs for various configurations.
19# Below are the input specific configurations.
20
21- type: log
22
23  # Change to true to enable this input configuration.
24  enabled: true
25
26  # Paths that should be crawled and fetched. Glob based paths.
27  paths:
28    - /filebeat/testlogs/input/*.log
29  include_lines: ['Exception','用户登录异常']
30    #- c:\programdata\elasticsearch\logs\*
31  #encoding: gbk
32  # Exclude lines. A list of regular expressions to match. It drops the lines that are
33  # matching any regular expression from the list.
34  #exclude_lines: ['^DBG']
35
36  # Include lines. A list of regular expressions to match. It exports the lines that are
37  # matching any regular expression from the list.
38  #include_lines: ['^ERR', '^WARN']
39
40  # Exclude files. A list of regular expressions to match. Filebeat drops the files that
41  # are matching any regular expression from the list. By default, no files are dropped.
42  #exclude_files: ['.gz$']
43
44  # Optional additional fields. These fields can be freely picked
45  # to add additional information to the crawled log files for filtering
46  #fields:
47  #  level: debug
48  #  review: 1
49
50  ### Multiline options
51
52  # Mutiline can be used for log messages spanning multiple lines. This is common
53  # for Java Stack Traces or C-Line Continuation
54
55  # The regexp Pattern that has to be matched. The example pattern matches all lines starting with [
56  #multiline.pattern: ^\[
57
58  # Defines if the pattern set under pattern should be negated or not. Default is false.
59  #multiline.negate: false
60
61  # Match can be set to "after" or "before". It is used to define if lines should be append to a pattern
62  # that was (not) matched before or after or as long as a pattern is not matched based on negate.
63  # Note: After is the equivalent to previous and before is the equivalent to to next in Logstash
64  #multiline.match: after
65
66multiline:
67 tail_files: true
68
69#============================= Filebeat modules ===============================
70
71filebeat.config.modules:
72  # Glob pattern for configuration loading
73  path: ${path.config}/modules.d/*.yml
74
75  # Set to true to enable config reloading
76  reload.enabled: false
77
78  # Period on which files under path should be checked for changes
79  #reload.period: 10s
80
81#==================== Elasticsearch template setting ==========================
82
83#setup.template.settings:
84  #index.number_of_shards: 3
85  #index.codec: best_compression
86  #_source.enabled: false
87
88#================================ General =====================================
89
90# The name of the shipper that publishes the network data. It can be used to group
91# all the transactions sent by a single shipper in the web interface.
92name: "study128"
93
94# The tags of the shipper are included in their own field with each
95# transaction published.
96#tags: ["service-X", "web-tier"]
97
98# Optional fields that you can specify to add additional information to the
99# output.
100#fields:
101#  env: staging
102
103
104#============================== Dashboards =====================================
105# These settings control loading the sample dashboards to the Kibana index. Loading
106# the dashboards is disabled by default and can be enabled either by setting the
107# options here, or by using the `-setup` CLI flag or the `setup` command.
108#setup.dashboards.enabled: false
109
110# The URL from where to download the dashboards archive. By default this URL
111# has a value which is computed based on the Beat name and version. For released
112# versions, this URL points to the dashboard archive on the artifacts.elastic.co
113# website.
114#setup.dashboards.url:
115
116#============================== Kibana =====================================
117
118# Starting with Beats version 6.0.0, the dashboards are loaded via the Kibana API.
119# This requires a Kibana endpoint configuration.
120#setup.kibana:
121
122  # Kibana Host
123  # Scheme and port can be left out and will be set to the default (http and 5601)
124  # In case you specify and additional path, the scheme is required: http://localhost:5601/path
125  # IPv6 addresses should always be defined as: https://[2001:db8::1]:5601
126  #host: "localhost:5601"
127
128#============================= Elastic Cloud ==================================
129
130# These settings simplify using filebeat with the Elastic Cloud (https://cloud.elastic.co/).
131
132# The cloud.id setting overwrites the `output.elasticsearch.hosts` and
133# `setup.kibana.host` options.
134# You can find the `cloud.id` in the Elastic Cloud web UI.
135#cloud.id:
136
137# The cloud.auth setting overwrites the `output.elasticsearch.username` and
138# `output.elasticsearch.password` settings. The format is `<user>:<pass>`.
139#cloud.auth:
140
141#================================ Outputs =====================================
142
143# Configure what output to use when sending the data collected by the beat.
144
145#-------------------------- Elasticsearch output ------------------------------
146#output.elasticsearch:
147  # Array of hosts to connect to.
148  #hosts: ["localhost:9200"]
149
150  # Optional protocol and basic auth credentials.
151  #protocol: "https"
152  #username: "elastic"
153  #password: "changeme"
154
155#----------------------------- Logstash output --------------------------------
156output.logstash:
157  # The Logstash hosts
158  hosts: ["127.0.0.1:10515"]
159
160  # Optional SSL. By default is off.
161  # List of root certificates for HTTPS server verifications
162  #ssl.certificate_authorities: ["/etc/pki/root/ca.pem"]
163
164  # Certificate for SSL client authentication
165  #ssl.certificate: "/etc/pki/client/cert.pem"
166
167  # Client Certificate Key
168  #ssl.key: "/etc/pki/client/cert.key"
169
170#================================ Logging =====================================
171
172# Sets log level. The default log level is info.
173# Available log levels are: error, warning, info, debug
174#logging.level: debug
175
176# At debug level, you can selectively enable logging only for some components.
177# To enable all selectors use ["*"]. Examples of other selectors are "beat",
178# "publish", "service".
179#logging.selectors: ["*"]
180
181#============================== Xpack Monitoring ===============================
182# filebeat can export internal metrics to a central Elasticsearch monitoring
183# cluster.  This requires xpack monitoring to be enabled in Elasticsearch.  The
184# reporting is disabled by default.
185
186# Set to true to enable the monitoring reporter.
187#xpack.monitoring.enabled: false
188
189# Uncomment to send the metrics to Elasticsearch. Most settings from the
190# Elasticsearch output are accepted here as well. Any setting that is not set is
191# automatically inherited from the Elasticsearch output configuration, so if you
192# have the Elasticsearch output configured, you can simply uncomment the
193# following line.
194#xpack.monitoring.elasticsearch:
195#scan_frequency: 30s
196#----------------------------- kafka output --------------------------------
197#output.kafka:
198#  enabled: true
199#  hosts: ["132.228.248.201:9092","132.228.248.202:9092","132.228.248.203:9092"]
200#  topic: ETE_CBA_ZZQS_LOG_ERROR
201#  version: 0.10.0.1
202
启动filebeat
./filebeat -e -c filebeat.yml -d "publish"
由于filebeat.yml启动会报错,执行修改filebeat.yml的权限(使用其建议的命令即可)

启动成功
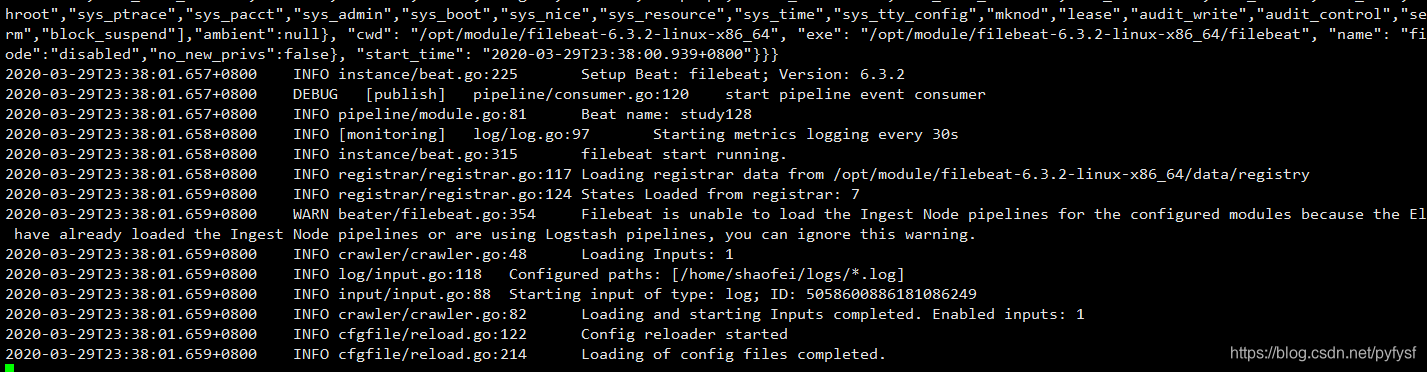
注意: 要保证filebeat.yml配置的采集路径是有读取权限的!
测试采集是否成功
-
在指定目录下创建测试日志
echo " 2020-03-27 16:51:25,422 ERROR com.quxuecx.Start ->net.sf.json.JSONException: JSONObject["matchID"] not found. 2020-03-27 16:51:25,422 ERROR com.quxuecx.Start ->net.sf.json.JSONException: JSONObject["matchID"] not found. 2020-03-27 16:51:25,422 ERROR com.quxuecx.Start ->net.sf.json.JSONException: JSONObject["matchID"] not found. ">>b.log
-
成功
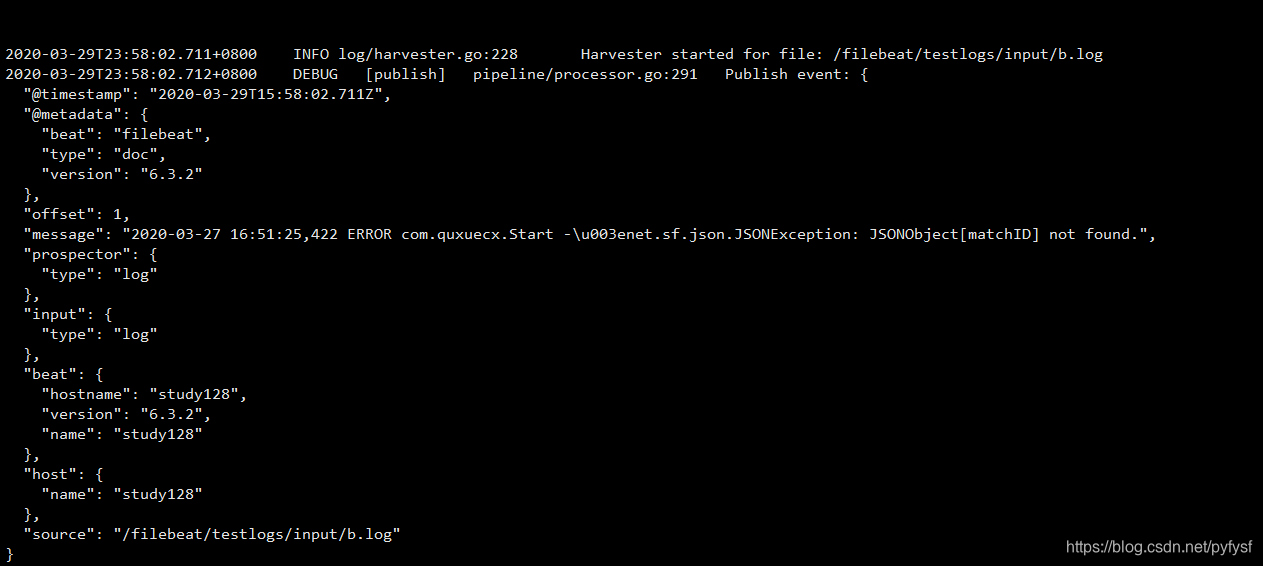
注意: 如果没有看到上述采集成功的图片,请仔细检查filebeat.yml配置文件以及所监听路径和文件的权限是否可以读取。 注意: 文件的内容,必须为log日志格式以及包括你所监听的关键字,请注意。

对接logstash测试
特别注意: filebeat.yml中配置的output.logstash: hosts: ["127.0.0.1:10515"]其中10515这个端口要和logstash配置文件中input filebeat的端口一致。
logstash的概述请查看>> https://blog.csdn.net/pyfysf/article/details/100942174
logstash的配置文件log_error.conf
1input {
2    # 配置filebeat
3    beats {
4        port => 10515
5    }
6}
7
8filter {
9
10}
11
12output {
13
14    # 配置输出到文件中
15    file{
16       path=>"/home/shaofei/output.log"
17    }
18
19    #配置输出到控制台
20	stdout{
21		codec=>rubydebug
22	}
23}
24
启动logstash
./bin/logstash -rf ./config/log_error.conf
配置文件log_error.conf
1input {
2    # 配置filebeat
3    beats {
4        port => 10515
5    }
6}
7
8filter {
9
10}
11
12output {
13
14    # 配置输出到文件中
15    file{
16       path=>"/home/shaofei/output.log"
17    }
18
19    #配置输出到控制台
20	stdout{
21		codec=>rubydebug
22	}
23}
24
启动logstash
./bin/logstash -rf ./config/log_error.conf