
简单实现3D柱状图
1package yh.JFreeChart;
2
3import java.awt.Color;
4import java.awt.Font;
5
6import org.jfree.chart.ChartFactory;
7import org.jfree.chart.ChartFrame;
8import org.jfree.chart.JFreeChart;
9import org.jfree.chart.axis.CategoryAxis;
10import org.jfree.chart.axis.NumberAxis;
11import org.jfree.chart.labels.ItemLabelAnchor;
12import org.jfree.chart.labels.ItemLabelPosition;
13import org.jfree.chart.labels.StandardCategoryItemLabelGenerator;
14import org.jfree.chart.plot.CategoryPlot;
15import org.jfree.chart.plot.PlotOrientation;
16import org.jfree.chart.renderer.category.BarRenderer3D;
17import org.jfree.chart.title.LegendTitle;
18import org.jfree.chart.title.TextTitle;
19import org.jfree.data.category.CategoryDataset;
20import org.jfree.data.general.DatasetUtilities;
21import org.jfree.ui.TextAnchor;
22
23/**
24 *
25 * @Title:JFreeChart实现柱状图
26 * @Description:Comment for created type
27 * @author 张颖辉
28 * @date 2017年1月24日上午10:43:44
29 * @version 1.0
30 */
31public class JFreeChartPillar {
32	/**
33	 * 获得数据集。
34	 *
35	 * @return org.jfree.data.category.CategoryDataset
36	 */
37	private static CategoryDataset getDataset1() {
38		double[][] data = new double[][] { { 751, 800, 260, 600, 200 }, { 400, 560, 240, 300, 150 },
39				{ 600, 450, 620, 220, 610 } };
40		String[] rowKeys = { "CPU", "硬盘", "内存" };
41		String[] columnKeys = { "北京", "上海", "广州", "南京", "深圳" };
42		CategoryDataset dataset = DatasetUtilities.createCategoryDataset(rowKeys, columnKeys, data);
43		return dataset;
44	}
45
46	/**
47	 * 生成柱状图。
48	 */
49	public static void main(String[] args) {
50		String title = "统计表";
51		// 获得数据集
52		CategoryDataset dataset = getDataset1();
53		JFreeChart chart = ChartFactory.createBarChart3D(title, // 图表标题
54				"时间", // 目录轴的显示标签
55				"次数", // 数值轴的显示标签
56				dataset, // 数据集
57				PlotOrientation.VERTICAL, // 图表方向:水平、垂直
58				true, // 是否显示图例
59				true, // 是否生成工具(提示)
60				false // 是否生成URL链接
61		);
62		// 设置标题字体
63		Font font = new Font("宋体", Font.BOLD, 18);
64		TextTitle textTitle = new TextTitle(title);
65		textTitle.setFont(font);
66		chart.setTitle(textTitle);
67		chart.setTextAntiAlias(false);
68		// 设置背景色
69		chart.setBackgroundPaint(new Color(255, 255, 255));
70		// 设置图例字体
71		LegendTitle legend = chart.getLegend(0);
72		legend.setItemFont(new Font("宋体", Font.TRUETYPE_FONT, 14));
73		// 获得柱状图的Plot对象
74		CategoryPlot plot = chart.getCategoryPlot();
75		BarRenderer3D customBarRenderer = (BarRenderer3D) plot.getRenderer();
76		// 取得横轴
77		CategoryAxis categoryAxis = plot.getDomainAxis();
78		// 设置横轴显示标签的字体
79		categoryAxis.setLabelFont(new Font("宋体", Font.BOLD, 16));
80		// 设置横轴标记的字体
81		categoryAxis.setTickLabelFont(new Font("宋休", Font.TRUETYPE_FONT, 16));
82		// 取得纵轴
83		NumberAxis numberAxis = (NumberAxis) plot.getRangeAxis();
84		// 设置纵轴显示标签的字体
85		numberAxis.setLabelFont(new Font("宋体", Font.BOLD, 16));
86		numberAxis.setTickLabelFont(new Font("Fixedsys", Font.PLAIN, 13));
87		customBarRenderer.setBaseItemLabelGenerator(new StandardCategoryItemLabelGenerator());// 显示每个柱的数值
88		customBarRenderer.setBaseItemLabelsVisible(true);
89		// 注意:此句很关键,若无此句,那数字的显示会被覆盖,给人数字没有显示出来的问题
90		customBarRenderer.setBasePositiveItemLabelPosition(
91				new ItemLabelPosition(ItemLabelAnchor.OUTSIDE12, TextAnchor.BASELINE_CENTER));
92		ChartFrame frame = new ChartFrame(title, chart, true);
93		frame.pack();
94		frame.setVisible(true);
95	}
96}
运行结果:
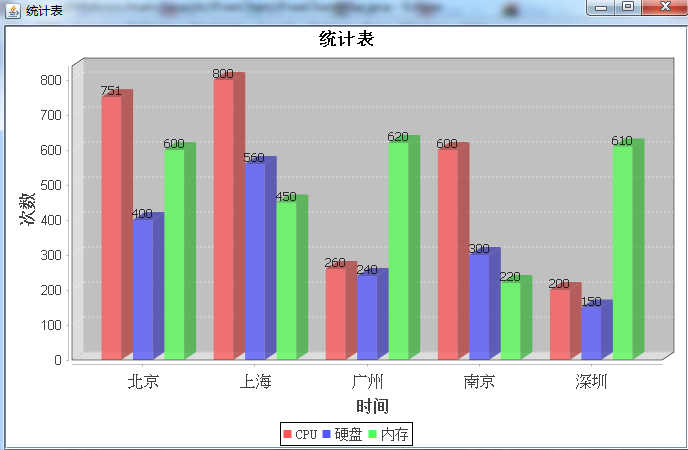
说明:中文标题文字可能不显示出现方格,解决办法是设置字体。
将图片写入流中的示例:
1package org.ruigai.util;
2
3import java.awt.Color;
4import java.awt.Font;
5import java.io.FileOutputStream;
6import java.io.IOException;
7import java.io.OutputStream;
8import java.text.DecimalFormat;
9import java.text.FieldPosition;
10import java.text.NumberFormat;
11import java.text.ParsePosition;
12
13import org.jfree.chart.ChartFactory;
14import org.jfree.chart.ChartFrame;
15import org.jfree.chart.ChartUtilities;
16import org.jfree.chart.JFreeChart;
17import org.jfree.chart.axis.CategoryAxis;
18import org.jfree.chart.axis.CategoryLabelPositions;
19import org.jfree.chart.axis.NumberAxis;
20import org.jfree.chart.axis.ValueAxis;
21import org.jfree.chart.labels.ItemLabelAnchor;
22import org.jfree.chart.labels.ItemLabelPosition;
23import org.jfree.chart.labels.StandardCategoryItemLabelGenerator;
24import org.jfree.chart.plot.CategoryPlot;
25import org.jfree.chart.plot.PlotOrientation;
26import org.jfree.chart.renderer.category.BarRenderer3D;
27import org.jfree.chart.title.LegendTitle;
28import org.jfree.data.category.CategoryDataset;
29import org.jfree.data.general.DatasetUtilities;
30import org.jfree.ui.TextAnchor;
31
32public class JFreeChartPillar {
33	private String title;// 大标题(如:什么什么图)
34	private String categoryAxisLabel;// X轴标题(如:按季度)
35	private String valueAxisLabel;// Y轴标题 (如:销量)
36	private OutputStream outputStream;// 接受数据的输出流
37	private CategoryDataset dataset;// 数据集对象
38
39	public JFreeChartPillar() {
40		super();
41	}
42
43	public JFreeChartPillar(String title, String categoryAxisLabel,
44			String valueAxisLabel, OutputStream outputStream,
45			CategoryDataset dataset) {
46		super();
47		this.title = title;
48		this.categoryAxisLabel = categoryAxisLabel;
49		this.valueAxisLabel = valueAxisLabel;
50		this.outputStream = outputStream;
51		this.dataset = dataset;
52	}
53
54	public String getCategoryAxisLabel() {
55		return categoryAxisLabel;
56	}
57
58	public void setCategoryAxisLabel(String categoryAxisLabel) {
59		this.categoryAxisLabel = categoryAxisLabel;
60	}
61
62	public CategoryDataset getDataset() {
63		return dataset;
64	}
65
66	public void setDataset(CategoryDataset dataset) {
67		this.dataset = dataset;
68	}
69
70	public String getTitle() {
71		return title;
72	}
73
74	public void setTitle(String title) {
75		this.title = title;
76	}
77
78	public String getValueAxisLabel() {
79		return valueAxisLabel;
80	}
81
82	public void setValueAxisLabel(String valueAxisLabel) {
83		this.valueAxisLabel = valueAxisLabel;
84	}
85
86	public OutputStream getOutputStream() {
87		return outputStream;
88	}
89
90	public void setOutputStream(OutputStream outputStream) {
91		this.outputStream = outputStream;
92	}
93
94	public void drawAsPNG() throws IOException {
95		// 创建3D柱形图标
96		JFreeChart jfreechart = ChartFactory.createBarChart3D(title,
97				categoryAxisLabel, valueAxisLabel, dataset,
98				PlotOrientation.VERTICAL, true, true, false);
99		// 设置标题字体
100		jfreechart.getTitle().setFont(new Font("隶书", Font.ITALIC, 20));
101		// 获得柱形图表情节对象
102		CategoryPlot categoryPlot = (CategoryPlot) jfreechart.getPlot();
103
104		// 设置网格线可见
105		categoryPlot.setDomainGridlinesVisible(true);
106
107		/********/
108		NumberAxis numberAxis = (NumberAxis) categoryPlot.getRangeAxis();
109		numberAxis.setRange(0.0, 100.0);
110		numberAxis.setStandardTickUnits(NumberAxis.createIntegerTickUnits());
111
112		/********/
113
114		// 获得x轴对象
115		CategoryAxis categoryAxis = categoryPlot.getDomainAxis();
116		// 设置x轴显示的分类名称的显示位置,如果不设置则水平显示
117		// 设置后,可以斜像显示,但分类角度,图表空间有限时,建议采用
118		categoryAxis.setCategoryLabelPositions(CategoryLabelPositions
119				.createUpRotationLabelPositions(0.39269908169872414D));
120		categoryAxis.setLabelFont(new Font("楷体", Font.BOLD, 14)); // X轴标题
121		categoryAxis.setTickLabelFont(new Font("宋体", Font.BOLD, 12)); // x轴下标
122		// 种类外部的间距
123		categoryAxis.setCategoryMargin(0.2);
124
125		// 柱形渲染器
126		BarRenderer3D renderer = (BarRenderer3D) categoryPlot.getRenderer();
127		renderer.setDrawBarOutline(false);// 设置不显示边框线
128		renderer.setItemMargin(0.1);// 分类内部间距
129		// 显示柱形数值
130		renderer
131				.setBaseItemLabelGenerator(new StandardCategoryItemLabelGenerator());
132		renderer.setBaseItemLabelsVisible(true);
133		renderer.setBasePositiveItemLabelPosition(new ItemLabelPosition(
134				ItemLabelAnchor.OUTSIDE12, TextAnchor.BASELINE_CENTER));
135
136		// 获取柱状
137		ValueAxis rangeAxis = categoryPlot.getRangeAxis();
138		rangeAxis.setLabelFont(new Font("楷体", Font.BOLD, 14)); // Y轴标题
139
140		// 图示项字体
141		LegendTitle legend = jfreechart.getLegend();
142		Font labelFont = new Font("宋体", Font.BOLD, 12);
143		legend.setItemFont(labelFont);
144
145		// 将图表已数据流的方式返回给客户端
146		ChartUtilities.writeChartAsPNG(outputStream, jfreechart, 500, 300);
147	}
148
149	public static void main(String[] agrs) throws IOException {
150		  double[][] data = new double[][] { { 75.1, 80.8, 26.9, 60.5 },
151		            { 40.3, 56.3, 24.5, 30.9 } };
152		        String[] rowKeys = {"上季", "本季"};
153		        String[] columnKeys = {"准度练习", "走位练习", "围球练习", "K球练习"};
154	    CategoryDataset dataset = DatasetUtilities.createCategoryDataset(
155	    		rowKeys, columnKeys, data);
156		// 打开一个输出流
157		OutputStream outputStream = new FileOutputStream("D:\\BarChart.png");
158		new JFreeChartPillar("专项成功率统计", null, "成功率(%)", outputStream,
159				dataset).drawAsPNG();
160	}
161}
运行结果:
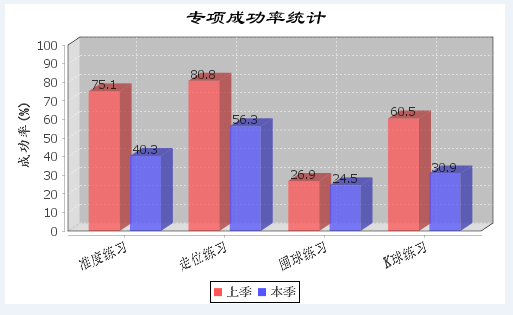
还未解决的问题:怎么将显示的数值和左侧标尺的数值显示为百分比?若您知道,请回复告知。
上面的解决办法只是制定了标尺的显示范围为1-100,通过Y轴标题说明是百分比。