
本篇文章讲解gdb的一些高级用法,在我们的开发生涯中,调试是很重要的技能,而在linux下开发,最常用的调试工具就是gdb了,所以这里介绍几种gdb比较高级的用法,助力我们的调试技能。
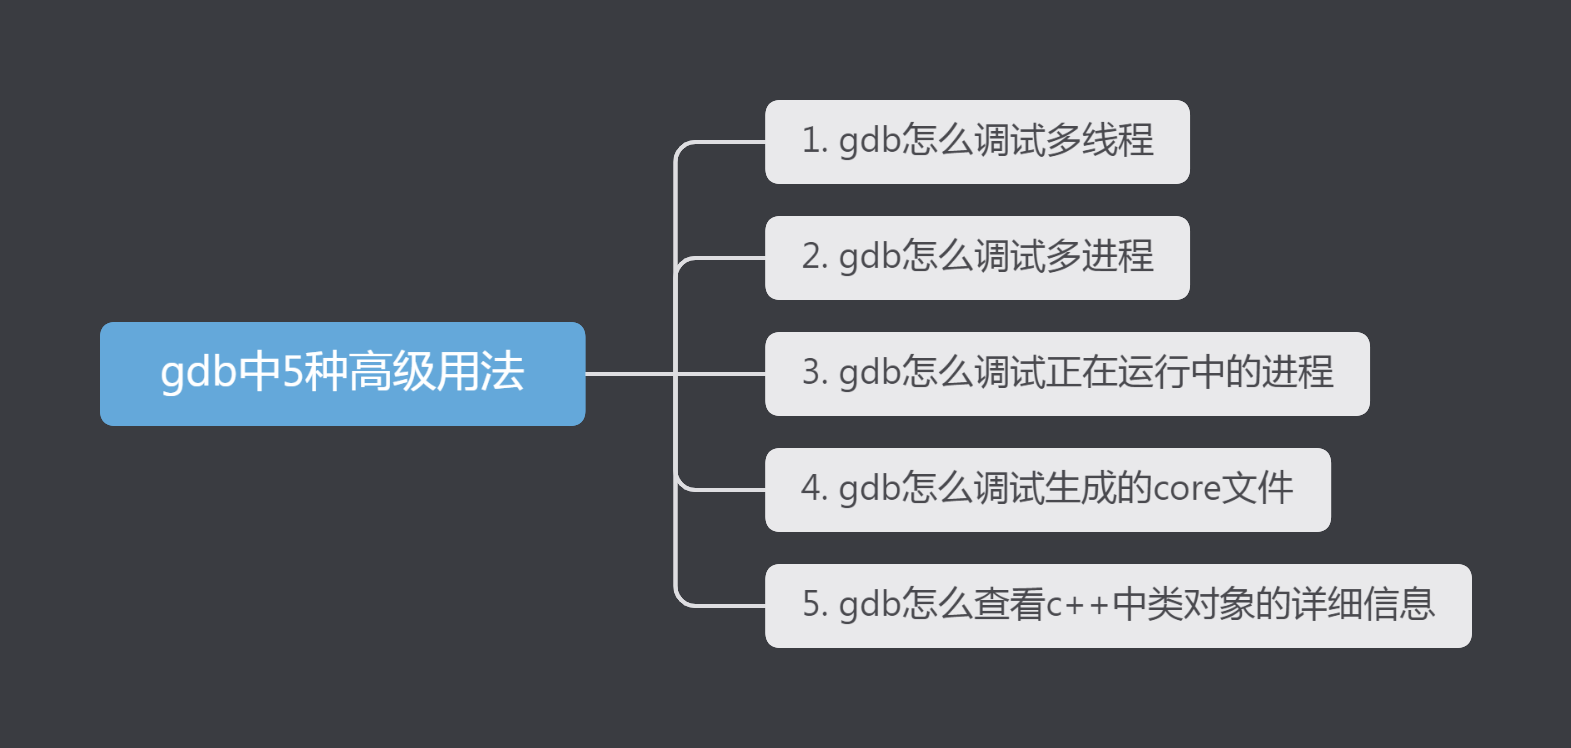
还是先看下思维导图:
1. gdb怎么调试多线程
gdb调试多线程时,默认情况下是所有线程同时都在执行,但是假设我们想只有一个线程继续执行,其他线程都暂停呢?下面就来看一看该怎么实现这个功能。
有这么一段多线程代码,如下:
1//test.cpp
2#include <stdio.h>
3#include <pthread.h>
4#include <unistd.h>
5
6void *print1_msg(void *arg)
7{
8	while(1)
9	{
10		printf("print1_msg\n");
11		usleep(100);
12	}
13}
14
15void *print2_msg(void *arg)
16{
17	while(1)
18	{
19		printf("print2_msg\n");
20		usleep(100);
21	}
22}
23
24int main()
25{
26    pthread_t id1, id2;
27    pthread_create(&id1, NULL, print1_msg, NULL);
28    pthread_create(&id2, NULL, print2_msg, NULL);
29    pthread_join(id1, NULL);  //使主线程等待该线程结束后才结束,否则主线程很快结束,该线程没有机会执行
30    pthread_join(id2, NULL);
31
32    return 0;
33}
假设我们因为线上的问题,然后想要程序只执行线程函数print1_msg,但不能修改代码,那要怎么办呢?
首先我们使用g++ -g test.cpp -l pthread -o test生成可执行文件,然后使用gdb ./test进入gdb模式,如下:
1(gdb) b test.cpp:28  #b就是break,打断点
2Breakpoint 1 at 0x40074e: file test.cpp, line 28.
3(gdb) r  #r即run,运行程序
4Starting program: /root/test
5[Thread debugging using libthread_db enabled]
6Using host libthread_db library "/lib64/libthread_db.so.1".
7[New Thread 0x40a00940 (LWP 26623)]
8print1_msg
9[New Thread 0x41401940 (LWP 26624)]
10
11Thread 1 hit Breakpoint 1, main () at test.cpp:28
1228	    pthread_join(id1, NULL);  //使主线程等待该线程结束后才结束,否则主线程很快结束,该线程没有机会执行
13(gdb) info thread   #显示当前进程的所有线程,第1号线程就是进程自身
14  Id   Target Id         Frame
15* 1    Thread 0x2aaaaae794d0 (LWP 26619) main () at test.cpp:28
16  2    Thread 0x40a00940 (LWP 26623) 0x00000036f289a901 in nanosleep () from /lib64/libc.so.6
17  3    Thread 0x41401940 (LWP 26624) 0x00000036f28d4971 in clone () from /lib64/libc.so.6
18(gdb) thread 2  #进入序号为2的线程
19[Switching to thread 2 (Thread 0x40a00940 (LWP 26623))]
20#0  0x00000036f289a901 in nanosleep () from /lib64/libc.so.6
21(gdb) set scheduler-locking on   #只有当前被调试线程会执行
22(gdb) c
23Continuing.
24print1_msg
25print1_msg
26print1_msg
27print1_msg
28print1_msg
大家可以看看注释,这样一番操作以后,实际上就只有第一个线程在执行了,此时如果执行gdb命令set scheduler-locking off就会继续执行所有线程了。
下面介绍一下多线程调试中会比较多用到的gdb命令:
| gdb命令 | 命令的作用 |
|---|---|
| info thread | 显示当前进程的所有线程,第一列代表线程序号,第1号线程就是进程自身,序号前面带*的就是当前正在执行的线程 |
| thread id | id代表线程序号,比如thread 2就是表示进入2号线程 |
| set scheduler-locking on | 设置该命令后,表示只有当前线程会被执行,其他线程相当于被锁住,会暂停 |
| set scheduler-locking off | 不锁定任何线程,设置该命令后,表示所有线程都会被执行,也是gdb的默认值 |
| set scheduler-locking step | 单步执行当前线程时,其他线程不会被执行,但此模式下不能执行continue、finish、until命令,一旦执行,那么其他线程都会被唤醒 |
| show scheduler-locking | 显示当前scheduler-locking的状态 |
| thread apply 1 2 command | 让线程序号为1和2的线程执行某个gdb命令,其中的command是gdb命令,比如thread apply 1 2 info local,让序号为1和2的线程打印出所有局部变量 |
| thread apply all command | command是gdb命令,让所有线程执行某个gdb命令 |
2. gdb怎么调试多进程
gdb调试多进程时最常用的是两个属性:follow-fork-mode和detach-on-fork,分别使用set follow-fork-mode parent|child和set detach-on-fork on|off这样的形式来进行设置,一般来讲,这两个命令是联合起来起作用的,下面就介绍一下他们的作用,如下:
| follow-fork-mode | detach-on-fork | 说明 |
|---|---|---|
| parent | on | 此种场景是gdb默认场景,表明gdb此时只调试父进程,包括打断点等都只对父进程起作用,子进程就继续运行,此时gdb不控制子进程 |
| parent | off | 此种场景下gdb同时控制父子进程,父进程可以正常调试,但子进程被gdb设置为暂停状态,不会继续执行 |
| child | on | 此种场景下gdb只控制子进程,gdb的所有命令都只对子进程起作用,父进程会继续运行 |
| child | off | 此种场景下gdb同时控制父子进程,子进程可以正常调试,但父进程被gdb设置为暂停状态,不会继续执行 |
此外还有一些其他调试多进程会用到的命令,如下:
| gdb命令 | 作用说明 |
|---|---|
| show follow-fork-mode | 显示follow-fork-mode状态 |
| show detach-on-fork | 显示detach-on-fork状态 |
| info inferiors | 查询gdb当前可调试的进程 |
| inferior <infer number> | 切换调试的进程,其中infer number是info inferiors命令打印出来的进程序号 |
接下来我们使用一个案例来说明上述命令的使用,有如下一段代码:
1//test.cpp
2#include <stdio.h>
3#include <sys/types.h>
4#include <unistd.h>
5
6int main()
7{
8	if ( fork() > 0)
9	{
10		while(1)
11		{
12			printf("this is parent\n");
13			sleep(1);
14		}
15	}
16	else
17	{
18		while(1)
19		{
20			printf("this is son\n");
21			sleep(1);
22		}
23	}
24	return 0;
25}
实际情况下代码肯定不能我这么写哈,要考虑到僵尸进程的产生,我这里只是为了排除其他干扰来说明gdb调试多进程的过程,所以写的很简洁。
假设这段代码编译后产生的执行文件为test,我们接着使用gdb对它进行调试,首先使用一下基本的命令,如下:
1(gdb) show follow-fork-mode
2Debugger response to a program call of fork or vfork is "parent".
3(gdb) show detach-on-fork
4Whether gdb will detach the child of a fork is on.
打印处理这两种设置模式的默认值,这个跟我们前面说的这个是gdb默认场景是一致的哈,此时我们分别在父进程和子进程代码处设置断点,然后运行看一下:
1(gdb) b test.cpp:11
2Breakpoint 1 at 0x40064e: file test.cpp, line 11.
3(gdb) b test.cpp:19
4Breakpoint 2 at 0x400664: file test.cpp, line 19.
5(gdb) r
6Starting program: /root/test
7this is son
8
9Breakpoint 1, main () at test.cpp:11
1011				printf("this is parent\n");
11(gdb) this is son
12this is son
13this is son
14this is son
可以看到只命中了父进程的断点,而子进程依然我行我素的运行。
接着假设我此时只想调试子进程,并且不想父进程继续运行,gdb命令如下:
1(gdb) set follow-fork-mode child
2(gdb) set detach-on-fork off
3(gdb) b test.cpp:11
4Breakpoint 1 at 0x40064e: file test.cpp, line 11.
5(gdb) b test.cpp:19
6Breakpoint 2 at 0x400664: file test.cpp, line 19.
7(gdb) r
8Starting program: /root/test
9[New process 29409]
10Reading symbols from /root/test...done.
11Reading symbols from /usr/lib64/libstdc++.so.6...done.
12[Switching to process 29409]
13
14Thread 2.1 hit Breakpoint 2, main () at test.cpp:19
1519				printf("this is son\n");
16(gdb) c
17Continuing.
18this is son
19
20Thread 2.1 hit Breakpoint 2, main () at test.cpp:19
2119				printf("this is son\n");
22(gdb) c
23Continuing.
24this is son
25
26Thread 2.1 hit Breakpoint 2, main () at test.cpp:19
2719				printf("this is son\n");
此时父子进程都被gdb控制,并且只有子进程会命中断点,父进程被暂停了,所以既没有命中断点也没有继续执行。
3. gdb怎么调试正在运行中的进程
在实际情况中有很多场景,我们需要去调试正在运行中的进程,此时该怎么调试呢,有两种办法:
- gdb <program> PID或者gdb -p PID,program是进程名,PID是进程在操作系统中的进程号,用ps命令查看即可,两种命令作用是一样的;
- gdb <program>以后,在gdb模式下attach PID也可以起到同样的作用,即挂载某个进程到gdb中;
上述两种方法进入调试模式后,如果不想继续调试直接在gdb模式下使用detach命令取消gdb挂载的进程即可。
下面用一个案例来说明一下,假设有下面这段代码:
1#include <stdio.h>
2#include <sys/types.h>
3#include <unistd.h>
4
5int main()
6{
7	int i = 0;
8	while(1)
9	{
10		i++;
11		sleep(1);
12	}
13	return 0;
14}
程序已经运行一段时间了,此时我想知道i的值是多少了,该怎么办呢,首先用ps命令查出进程的ID为29549,然后gdb -p 29549进入gdb模式,使用如下gdb命令查看即可:
1(gdb) b test.cpp:10
2Breakpoint 1 at 0x4005bb: file test.cpp, line 10.
3(gdb) c
4Continuing.
5
6Breakpoint 1, main () at test.cpp:10
710			i++;
8(gdb) p i
9$1 = 165
4. gdb怎么调试生成的core文件
core文件一般是产生段错误产生的哈,也就是使用空指针或者有内存越界之类的动作会产生,但要产生core文件也是需要设置的,一般linux下使用ulimit命令即可,比如使用ulimit -c看下打印的值,如果不是unlimited,那么使用ulimit -c unlimited设置一下即可,关于ulimit命令的更多使用这里就不多做介绍了。
我的机器现在已经开启了core文件生成的开关,那么现在有这么一段代码,如下:
1#include <stdio.h>
2
3int main()
4{
5	char *str = NULL;
6	printf("%s\n", str);
7	return 0;
8}
然后执行,果不其然,输出了段错误 (core dumped)这样的语句,可见是产生了core文件,我这里产生的core文件名为core.29626,此时我们可以使用gdb <program> core.29626这样的命令来进入gdb进行调试,如下:
1(gdb) bt
2#0  0x00000036f2879ba0 in strlen () from /lib64/libc.so.6
3#1  0x00000036f28631cb in puts () from /lib64/libc.so.6
4#2  0x00000000004005c8 in main () at test.cpp:6
使用bt命令即可查看出错的到底是哪个函数,哪行代码啦。
5. gdb怎么查看c++中类对象的详细信息
假设有这么一段c++代码,如下:
1class CPeople
2{
3public:
4	int age;
5public:
6	virtual void print(){}
7};
8
9class CBigPeople : public CPeople
10{
11public:
12	int height;
13};
14
15int main()
16{
17	CPeople *people = new CBigPeople;
18	delete people;
19	return 0;
20}
我们使用gdb查看people所指向的类型,如下:
1(gdb) p *people
2$2 = {_vptr.CPeople = 0x4008b0 <vtable for CBigPeople+16>, age = 0}
很显然默认情况下gdb没能显示出来真实类型,我们打开一个开关,如下:
1(gdb) set print object on
2(gdb) p *people
3$3 = (CBigPeople) {<CPeople> = {_vptr.CPeople = 0x4008b0 <vtable for CBigPeople+16>, age = 0}, height = 0}
这是类型都显示在一行里面,如果是简单类型还好,如果类型很复杂的时候,这个就很难看了,所以我们可以让gdb显示树形结构,如下:
1(gdb) set print pretty on
2(gdb) p *people
3$5 = (CBigPeople) {
4  <CPeople> = {
5    _vptr.CPeople = 0x4008c0 <vtable for CBigPeople+16>,
6    age = 0
7  },
8  members of CBigPeople:
9  height = 0
10}
6. 小结
其实linux下调试gdb真的是个很强大的命令,仔细研究一下,我们会发现,只要我们能想到的功能,gdb真的都能实现,同时我们要善用gdb的help命令,它可以打印出所有的gdb命令和它的作用,如果你不想打印那么多,你可以只打印某个单一命令或者某一类命令,比如:
1(gdb) help shell  #打印出gdb中shell命令的作用,它可以让我们直接在gdb下执行shell命令
2Execute the rest of the line as a shell command.
3With no arguments, run an inferior shell.
4(gdb) help info  #打印出gdb中info开头的所有命令
5Generic command for showing things about the program being debugged.
6
7List of info subcommands:
8
9info address -- Describe where symbol SYM is stored
10info all-registers -- List of all registers and their contents
11info args -- Argument variables of current stack frame
12info auto-load -- Print current status of auto-loaded files
13info auxv -- Display the inferior's auxiliary vector
14info bookmarks -- Status of user-settable bookmarks
15info breakpoints -- Status of specified breakpoints (all user-settable breakpoints if no argument)
16info checkpoints -- IDs of currently known checkpoints
17info classes -- All Objective-C classes
18info common -- Print out the values contained in a Fortran COMMON block
19info copying -- Conditions for redistributing copies of GDB
20info dcache -- Print information on the dcache performance
21info display -- Expressions to display when program stops
22......  #篇幅有限,后续省略了
好了,本篇文章就为大家介绍到这里,觉得内容对你有用的话,记得顺手点个赞哦~