
前言
之前需要在Scala中用到类似python的graphviz库的功能,用来在Mxnet中可视化网络结构,
但是在网上搜索了一下,没有找到好用的库,所以就自己去把python的graphviz库中的主要功能
用Scala实现了一下,尽量的保持接口和python库的一致,也方便从python移植相关的代码到
Scala,然后我把这个小项目开源了,地址是Graphviz4S,有兴趣的朋友可以去试用一下。
接下来我会结合代码,用几个例子来介绍如何使用这个小工具。
正文
接下来我会通过几个例子介绍Grapphviz4S,例子参考自这篇博客。
1、简单例子
1.1、简单图例
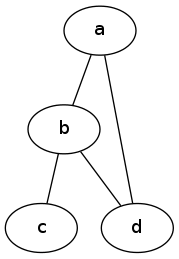
首先来看第一个例子,Scala代码如下:
1    import com.liangdp.graphviz4s.Graph
2    val dot = new Graph(name = "graphname")
3    dot.edges(Array(
4      ("a", "b"),
5      ("b", "c"),
6      ("b", "d"),
7      ("d", "a")
8    ))
9
10    println(dot.source())
11//    graph graphname {
12//    		a -- b
13//    		b -- c
14//    		b -- d
15//    		d -- a
16//    }
17
18    dot.render(fileName = "graphname.gv", directory = ".", view = true)
生成的结果如下:
1.2、简单图例2
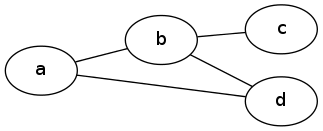
第二个例子和上面的一样,但是布局不同,Scala代码如下:
1    import com.liangdp.graphviz4s.Graph
2    val dot = new Graph(name = "graphname")
3
4    dot.body += "\t\trankdir=LR  //Rank Direction Left to Right"
5    dot.edges(Array(
6      ("a", "b"),
7      ("b", "c"),
8      ("b", "d"),
9      ("d", "a")
10    ))
11
12    println(dot.source())
13//    graph graphname {
14//    		rankdir=LR  //Rank Direction Left to Right
15//    		a -- b
16//    		b -- c
17//    		b -- d
18//    		d -- a
19//    }
20
21    dot.render(fileName = "graphname.gv", directory = ".", view = true)
生成的结果如下:
1.3、简单有向图
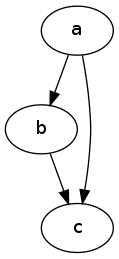
第三个例子是一个简单的有向图,Scala代码如下:
1    import com.liangdp.graphviz4s.Digraph
2    val dot = new Digraph(name = "graphname")
3
4    dot.edges(Array(
5      ("a", "b"),
6      ("b", "c"),
7      ("a", "c")
8    ))
9
10    println(dot.source())
11//    digraph graphname {
12//    		a -> b
13//    		b -> c
14//    		a -> c
15//    }
16
17    dot.render(fileName = "graphname.gv", directory = ".", view = true)
生成的结果如下:
1.4、带标签的简单有向图
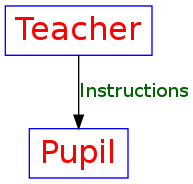
第四个例子给有向图的边加上标签,对应的Scala代码如下:
1    import com.liangdp.graphviz4s.Digraph
2    val dot = new Digraph(name = "graphname")
3
4    dot.node(name = "T", label = "Teacher")
5    dot.node(name = "P", label = "Pupil")
6
7    import scala.collection.mutable.Map
8    dot.edge(tailName = "T", headName = "P", label = "Instructions",
9        attrs = Map("fontcolor" -> "darkgreen"))
10
11    println(dot.source())
12//    digraph graphname {
13//    	"T" [label="Teacher" ]
14//    	"P" [label="Pupil" ]
15//    		T -> P [label="Instructions"  fontcolor=darkgreen]
16//    }
17
18    dot.render(fileName = "graphname.gv", directory = ".", view = true)
生成的结果如下:
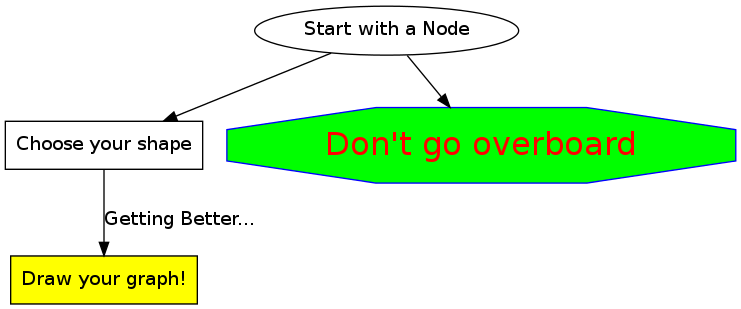
1.5、总结
Scala代码:
1    import com.liangdp.graphviz4s.Digraph
2    val dot = new Digraph(name = "summary")
3
4    dot.node(name = "start", label = "Start with a Node")
5    import scala.collection.mutable.Map
6    dot.node(name = "next", label = "Choose your shape", attrs = Map("shape" -> "box"))
7    dot.node(name = "warning", label = "Don't go overboard",
8        attrs = Map("color" -> "Blue", "fontcolor" -> "Red", "fontsize" -> "24",
9            "style" -> "filled", "fillcolor" -> "green", "shape" -> "octagon"))
10    dot.node(name = "end", label = "Draw your graph!",
11        attrs = Map("shape" -> "box", "style" -> "filled", "fillcolor" -> "yellow"))
12
13    dot.edge(tailName = "start", headName = "next")
14    dot.edge(tailName = "start", headName = "warning")
15    dot.edge(tailName = "next", headName = "end", label = "Getting Better...")
16
17    println(dot.source())
18//    digraph summary {
19//    	"start" [label="Start with a Node" ]
20//    	"next" [label="Choose your shape"  shape=box]
21//    	"warning" [label="Don't go overboard"  fontsize=24 color=Blue fillcolor=green shape=octagon fontcolor=Red style=filled]
22//    	"end" [label="Draw your graph!"  fillcolor=yellow shape=box style=filled]
23//    		start -> next []
24//    		start -> warning []
25//    		next -> end [label="Getting Better..." ]
26//    }
27
28    dot.render(fileName = "graphname.gv", directory = ".", view = true)
生成的结果如下:
2、高级例子
2.1、少写一点代码
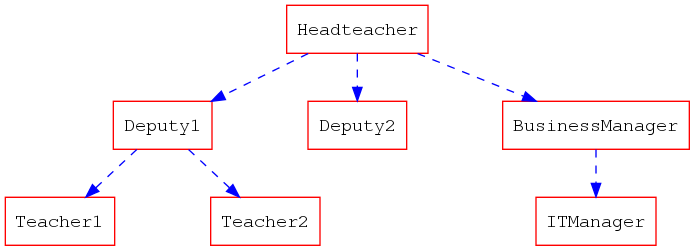
单独地去定义每一个节点的属性很浪费时间,下面这个技巧能够让你coding的速度快一点。
Scala代码如下:
1    import com.liangdp.graphviz4s.Digraph
2    val dot = new Digraph(name = "hierarchy")
3
4    // increases the separation between nodes
5    dot.body += "\tnodesep=1.0"
6    import scala.collection.mutable.Map
7    //All nodes will this shape and colour
8    dot.attr("node", attrs =
9      Map("color" -> "Red", "fontname" -> "Courier", "shape" -> "box"))
10    //All the lines look like this
11    dot.attr("edge", attrs = Map("color" -> "Blue", "style" -> "dashed"))
12
13    dot.edges("Headteacher", Array("Deputy1", "Deputy2", "BusinessManager"))
14    dot.edges("Deputy1", Array("Teacher1", "Teacher2"))
15    dot.edge("BusinessManager", "ITManager")
16    // Put them on the same level
17    dot.body += "\t{rank=same;ITManager Teacher1 Teacher2}"
18
19    println(dot.source())
20//    digraph hierarchy {
21//    	nodesep=1.0
22//    	node [ fontname=Courier color=Red shape=box]
23//    	edge [ color=Blue style=dashed]
24//    		Headteacher -> Deputy1
25//    		Headteacher -> Deputy2
26//    		Headteacher -> BusinessManager
27//    		Deputy1 -> Teacher1
28//    		Deputy1 -> Teacher2
29//    		BusinessManager -> ITManager []
30//    	{rank=same;ITManager Teacher1 Teacher2}
31//    }
32
33    dot.render(fileName = "graphname.gv", directory = ".", view = true)
结果如下:
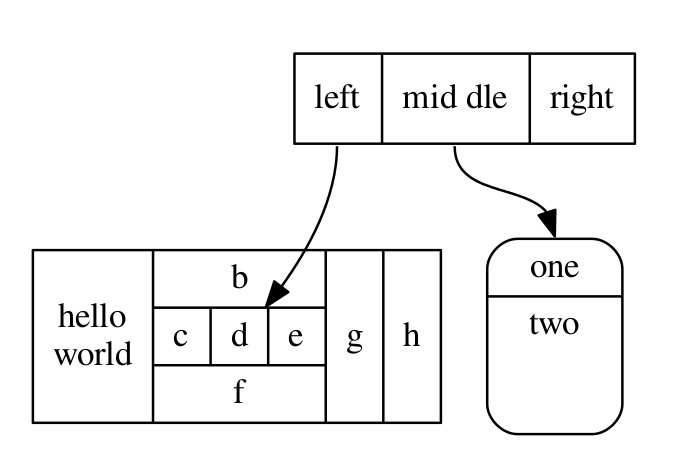
2.2、html
Scala代码如下:
1    import com.liangdp.graphviz4s.Digraph
2    val dot = new Digraph(name = "structs")
3
4    import scala.collection.mutable.Map
5    dot.attr("node", attrs = Map("shape" -> "record"))
6    dot.node("struct1", label = """"<f0> left|<f1> mid\ dle|<f2> right"""")
7    dot.node("struct2", label = """"{<f0> one|<f1> two\n\n\n}"""",
8        attrs = Map("shape" -> "Mrecord"))
9    dot.node("struct3", label = """"hello\nworld |{ b |{c|<here> d|e}| f}| g | h"""")
10
11    dot.edge("struct1:f1", "struct2:f0")
12    dot.edge("struct1:f0", "struct3:here")
13
14    println(dot.source())
15//    digraph structs {
16//    	node [ shape=record]
17//    	"struct1" [label="<f0> left|<f1> mid\ dle|<f2> right" ]
18//    	"struct2" [label="{<f0> one|<f1> two\n\n\n}"  shape=Mrecord]
19//    	"struct3" [label="hello\nworld |{ b |{c|<here> d|e}| f}| g | h" ]
20//    		struct1:f1 -> struct2:f0 []
21//    		struct1:f0 -> struct3:here []
22//    }
23
24    dot.render(fileName = "graphname.gv", directory = ".", view = true)
结果如下:
2.3、有限状态机
Scala代码如下:
1    import com.liangdp.graphviz4s.Digraph
2    val dot = new Digraph(name = "structs")
3
4    dot.body += "\trankdir=LR"
5    dot.body += s"""${"\t"}size="8,5""""
6
7    import scala.collection.mutable.Map
8    dot.attr("node", attrs = Map("shape" -> "circle"))
9    dot.edge(tailName = "S0", headName = "S1", label = """"Lift Nozzle"""")
10    dot.edge(tailName = "S1", headName = "S0", label = """"Replace Nozzle"""")
11    dot.edge(tailName = "S1", headName = "S2", label = """"Authorize Pump"""")
12    dot.edge(tailName = "S2", headName = "S0", label = """"Replace Nozzle"""")
13    dot.edge(tailName = "S2", headName = "S3", label = """"Pull Trigger"""")
14    dot.edge(tailName = "S3", headName = "S2", label = """"Release Trigger"""")
15
16    println(dot.source())
17//    digraph structs {
18//    	rankdir=LR
19//    	size="8,5"
20//    	node [ shape=circle]
21//    		S0 -> S1 [label="Lift Nozzle" ]
22//    		S1 -> S0 [label="Replace Nozzle" ]
23//    		S1 -> S2 [label="Authorize Pump" ]
24//    		S2 -> S0 [label="Replace Nozzle" ]
25//    		S2 -> S3 [label="Pull Trigger" ]
26//    		S3 -> S2 [label="Release Trigger" ]
27//    }
28
29    dot.render(fileName = "graphname.gv", directory = ".", view = true)
结果如下:

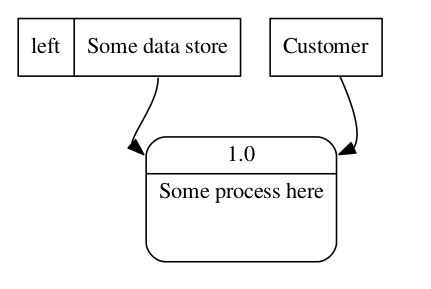
2.4、数据流示意图
Scala代码如下:
1    import com.liangdp.graphviz4s.Digraph
2    val dot = new Digraph(name = "dfd")
3
4    import scala.collection.mutable.Map
5    dot.attr("node", attrs = Map("shape" -> "record"))
6    dot.node("store1", label = """"<f0> left|<f1> Some data store"""")
7    dot.node("proc1", label = """"{<f0> 1.0|<f1> Some process here\n\n\n}"""",
8        attrs = Map("shape" -> "Mrecord"))
9    dot.node("enti1", label = "Customer",
10        attrs = Map("shape" -> "box"))
11
12    dot.edge(tailName = "store1:f1", headName = "proc1:f0")
13    dot.edge(tailName = "enti1", headName = "proc1:f0")
14
15    println(dot.source())
16//    digraph dfd {
17//    	node [ shape=record]
18//    	"store1" [label="<f0> left|<f1> Some data store" ]
19//    	"proc1" [label="{<f0> 1.0|<f1> Some process here\n\n\n}"  shape=Mrecord]
20//    	"enti1" [label="Customer"  shape=box]
21//    		store1:f1 -> proc1:f0 []
22//    		enti1 -> proc1:f0 []
23//    }
24
25    dot.render(fileName = "graphname.gv", directory = ".", view = true)
结果如下:
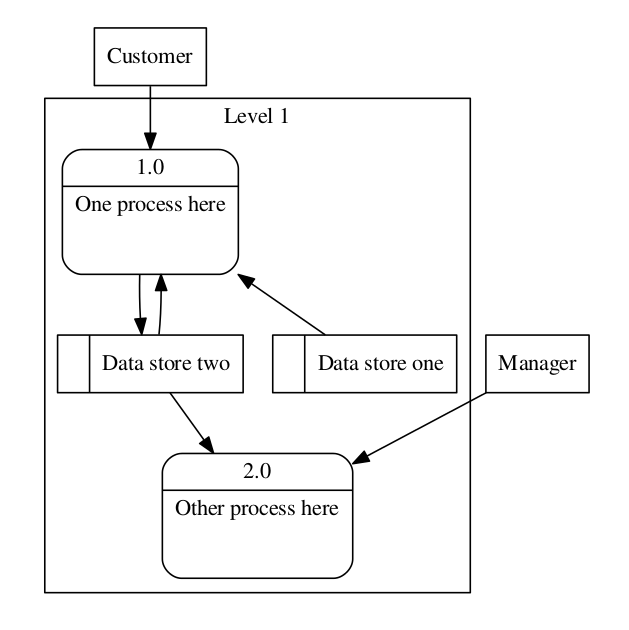
2.5、数据流示意图2
Scala代码如下:
1    import com.liangdp.graphviz4s.Digraph
2    val dot = new Digraph(name = "dfd2")
3
4    import scala.collection.mutable.Map
5    dot.attr("node", attrs = Map("shape" -> "record"))
6
7    val subgraph0 = new Digraph(name = "level0")
8    subgraph0.node("enti1", label = "Customer", Map("shape" -> "box"))
9    subgraph0.node("enti2", label = "Manager", Map("shape" -> "box"))
10
11    val subgraph1 = new Digraph(name = "cluster_level1")
12    subgraph1.body += s"""${"\t"}label ="Level 1""""
13    subgraph1.node("proc1", label = """"{<f0> 1.0|<f1> One process here\n\n\n}"""",
14        attrs = Map("shape" -> "Mrecord"))
15    subgraph1.node("proc2", label = """"{<f0> 2.0|<f1> Other process here\n\n\n}"""",
16        attrs = Map("shape" -> "Mrecord"))
17    subgraph1.node("store1", label = """"<f0>    |<f1> Data store one"""")
18    subgraph1.node("store2", label = """"<f0>   |<f1> Data store two"""")
19    subgraph1.body += "\t{rank=same; store1, store2}"
20
21    dot.subGraph(subgraph0)
22    dot.subGraph(subgraph1)
23
24    dot.edge("enti1", "proc1")
25    dot.edge("enti2", "proc2")
26    dot.edge("store1", "proc1")
27    dot.edge("store2", "proc2")
28    dot.edge("proc1", "store2")
29    dot.edge("store2", "proc1")
30
31    println(dot.source())
32//    digraph dfd2 {
33//    	node [ shape=record]
34//    	subgraph level0 {
35//    		"enti1" [label="Customer"  shape=box]
36//    		"enti2" [label="Manager"  shape=box]
37//    	}
38//    	subgraph cluster_level1 {
39//    		label ="Level 1"
40//    		"proc1" [label="{<f0> 1.0|<f1> One process here\n\n\n}"  shape=Mrecord]
41//    		"proc2" [label="{<f0> 2.0|<f1> Other process here\n\n\n}"  shape=Mrecord]
42//    		"store1" [label="<f0>    |<f1> Data store one" ]
43//    		"store2" [label="<f0>   |<f1> Data store two" ]
44//    		{rank=same; store1, store2}
45//    	}
46//    		enti1 -> proc1 []
47//    		enti2 -> proc2 []
48//    		store1 -> proc1 []
49//    		store2 -> proc2 []
50//    		proc1 -> store2 []
51//    		store2 -> proc1 []
52//    }
53
54    dot.render(fileName = "graphname.gv", directory = ".", view = true)
结果如下:
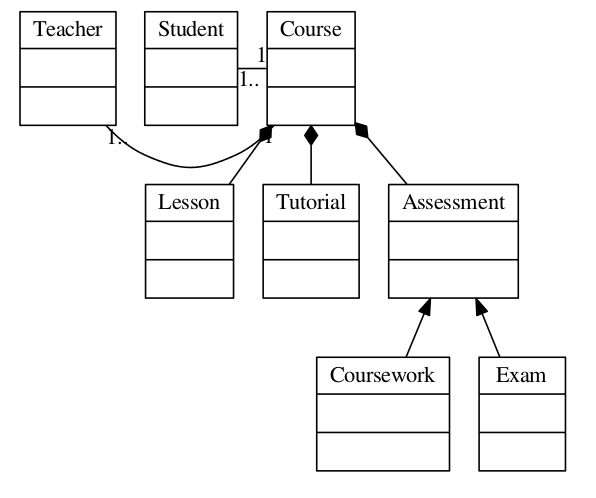
2.6、对象继承
Scala代码如下:
1    import com.liangdp.graphviz4s.Digraph
2    val dot = new Digraph(name = "obj")
3
4    import scala.collection.mutable.Map
5    dot.attr("node", attrs = Map("shape" -> "record"))
6
7    dot.body += s"""${"\t"}rankdir="BT""""
8
9    dot.node("teacher", label = """"{<f0> Teacher|<f1> \n  |<f2> \n   }"""")
10    dot.node("course", label = """"{<f0> Course|<f1> \n  |<f2> \n   }"""")
11    dot.node("student", label = """"{<f0> Student|<f1> \n  |<f2> \n   }"""")
12    dot.node("lesson", label = """"{<f0> Lesson |<f1> \n  |<f2> \n   }"""")
13    dot.node("tutorial", label = """"{<f0> Tutorial|<f1> \n  |<f2> \n   }"""")
14    dot.node("assessment", label = """"{<f0> Assessment|<f1> \n  |<f2> \n   }"""")
15    dot.node("coursework", label = """"{<f0> Coursework|<f1> \n  |<f2> \n   }"""")
16    dot.node("exam", label = """"{<f0> Exam|<f1> \n  |<f2> \n   }"""")
17
18    dot.body += "\t{rank=same; teacher course student}"
19
20    dot.edge("teacher", "course", attrs = Map("dir" -> "forward", "arrowhead" -> "none",
21        "arrowtail" -> "normal", "headlabel" -> """"1"""", "taillabel" -> """"1..""""))
22    dot.edge("student", "course", attrs = Map("dir" -> "forward", "arrowhead" -> "none",
23        "arrowtail" -> "normal", "headlabel" -> """"1"""", "taillabel" -> """"1..""""))
24    dot.edge("lesson", "course", attrs = Map("dir" -> "forward", "arrowhead" -> "diamond",
25        "arrowtail" -> "normal"))
26    dot.edge("tutorial", "course", attrs = Map("dir" -> "forward", "arrowhead" -> "diamond",
27        "arrowtail" -> "normal"))
28    dot.edge("assessment", "course", attrs = Map("dir" -> "forward", "arrowhead" -> "diamond",
29        "arrowtail" -> "normal"))
30    dot.edge("coursework", "assessment")
31    dot.edge("exam", "assessment")
32
33    println(dot.source())
34//    digraph obj {
35//    	node [ shape=record]
36//    	rankdir="BT"
37//    	"teacher" [label="{<f0> Teacher|<f1> \n  |<f2> \n   }" ]
38//    	"course" [label="{<f0> Course|<f1> \n  |<f2> \n   }" ]
39//    	"student" [label="{<f0> Student|<f1> \n  |<f2> \n   }" ]
40//    	"lesson" [label="{<f0> Lesson |<f1> \n  |<f2> \n   }" ]
41//    	"tutorial" [label="{<f0> Tutorial|<f1> \n  |<f2> \n   }" ]
42//    	"assessment" [label="{<f0> Assessment|<f1> \n  |<f2> \n   }" ]
43//    	"coursework" [label="{<f0> Coursework|<f1> \n  |<f2> \n   }" ]
44//    	"exam" [label="{<f0> Exam|<f1> \n  |<f2> \n   }" ]
45//    	{rank=same; teacher course student}
46//    		teacher -> course [ arrowtail=normal dir=forward taillabel="1.." arrowhead=none headlabel="1"]
47//    		student -> course [ arrowtail=normal dir=forward taillabel="1.." arrowhead=none headlabel="1"]
48//    		lesson -> course [ arrowtail=normal dir=forward arrowhead=diamond]
49//    		tutorial -> course [ arrowtail=normal dir=forward arrowhead=diamond]
50//    		assessment -> course [ arrowtail=normal dir=forward arrowhead=diamond]
51//    		coursework -> assessment []
52//    		exam -> assessment []
53//    }
54
55    dot.render(fileName = "graphname.gv", directory = ".", view = true)
结果如下:
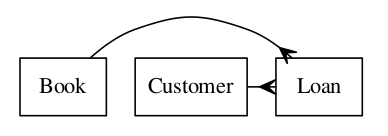
2.7、关系型实体
Scala代码如下:
1    import com.liangdp.graphviz4s.Digraph
2    val dot = new Digraph(name = "ER")
3
4    import scala.collection.mutable.Map
5    dot.attr("node", attrs = Map("shape" -> "box"))
6
7    dot.node("Book")
8    dot.node("Customer")
9    dot.node("Loan")
10
11    dot.body += "\t{rank=same;Book,Customer,Loan}"
12
13    dot.edge("Book", "Loan", attrs = Map("dir" -> "forward",
14        "arrowhead" -> "crow", "arrowtail" -> "normal"))
15    dot.edge("Customer", "Loan", attrs = Map("dir" -> "forward",
16        "arrowhead" -> "crow", "arrowtail" -> "normal"))
17
18    println(dot.source())
19//    digraph ER {
20//    	node [ shape=box]
21//    	"Book" []
22//    	"Customer" []
23//    	"Loan" []
24//    	{rank=same;Book,Customer,Loan}
25//    		Book -> Loan [ arrowtail=normal dir=forward arrowhead=crow]
26//    		Customer -> Loan [ arrowtail=normal dir=forward arrowhead=crow]
27//    }
28
29    dot.render(fileName = "graphname.gv", directory = ".", view = true)
结果:
结尾
通过以上例子的介绍,相信读者都能够了解如何使用这个小工具了,不过这个小工具还有很多
需要完善的地方,也欢迎感兴趣的朋友一起来完善它。