
1、git地址
https://github.com/ecomfe/vue-echarts
2、使用
(1)安装
npm install vue-echarts --save-dev
(2)引入
1import ECharts from 'vue-echarts'
2import 'echarts'
3
4components: { 'v-chart': ECharts }//引入组件
注意:
官方说明中引入是这样的:
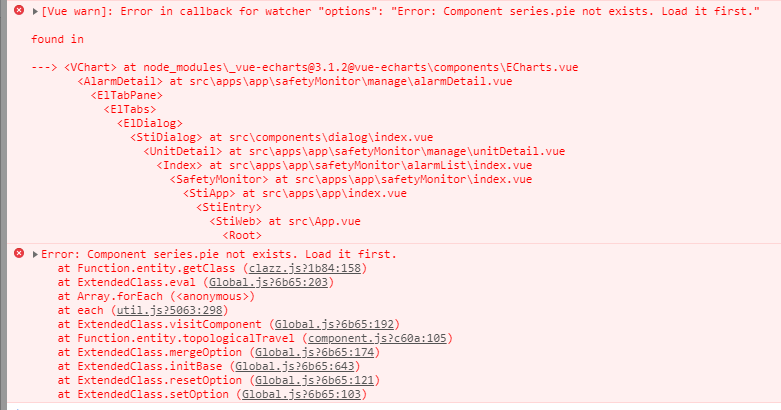
import ECharts from 'vue-echarts/components/ECharts.vue'
但是会报错:options": "Error: Component series.pie not exists. Load it first.
(3)代码
1<template>
2<v-chart :options="polar"/>
3</template>
4
5<style>
6.echarts {
7  width: 100%;
8  height: 100%;
9}
10</style>
11
12//data:
13data: function () {
14    let data = []
15
16    for (let i = 0; i <= 360; i++) {
17        let t = i / 180 * Math.PI
18        let r = Math.sin(2 * t) * Math.cos(2 * t)
19        data.push([r, i])
20    }
21
22    return {
23      polar: {
24        title: {
25          text: '极坐标双数值轴'
26        },
27        legend: {
28          data: ['line']
29        },
30        polar: {
31          center: ['50%', '54%']
32        },
33        tooltip: {
34          trigger: 'axis',
35          axisPointer: {
36            type: 'cross'
37          }
38        },
39        angleAxis: {
40          type: 'value',
41          startAngle: 0
42        },
43        radiusAxis: {
44          min: 0
45        },
46        series: [
47          {
48            coordinateSystem: 'polar',
49            name: 'line',
50            type: 'line',
51            showSymbol: false,
52            data: data
53          }
54        ],
55        animationDuration: 2000
56      }
57    }
58  }
(4)一个比较有用的属性
-
auto-resize(默认值:false)这个 prop 用来指定 ECharts 实例在组件根元素尺寸变化时是否需要自动进行重绘。