
一,什么是内存泄漏
Go 中的并发性是以 goroutine(独立活动)和 channel(用于通信)的形式实现的。处理 goroutine 时,程序员需要小心翼翼地避免泄露。如果最终永远堵塞在 I/O 上(例如 channel 通信),或者陷入死循环,那么 goroutine 会发生泄露。即使是阻塞的 goroutine,也会消耗资源,因此,程序可能会使用比实际需要更多的内存,或者最终耗尽内存,从而导致崩溃。虽然我们知道goroutine在初始化的时候会会分配一个2kb的栈地址空间,(关于内存分配的问题可以参考http://ifeve.com/memory-barriers-or-fences/)但是如果大量的goroutine被阻塞,造成的内存浪费也是客观的。
我们知道go采用的gc是标记回收法:
从根变量来时遍历所有被引用对象,标记之后进行清除操作,对未标记对象进行回收。
阻塞状态是go调度的一个待唤醒的状态,是不能被gc的。
我们知道:
如向channel发送数据的时候,该goroutine会一直阻塞直到另一个goroutine接受该channel的数据,反之亦然,goroutine接受channel的数据的时候也会一直阻塞直到另一个goroutine向该channel发送数据
发送端的channel满了,那么发送端将处于阻塞状态知道里面的消息被消费
1ch := make(chan int)
2go func() {
3ch <- 1
4fmt.Println(111)
5}()
接受端消费channel的时候发现为空
1ch := make(chan int, 1)
2go func() {
3<-ch
4fmt.Println(111)
5}()
上述的两种中状态就是最简单的goroutine阻塞的情况,我们遇到goroutine阻塞,从而导致的内存泄漏的情况无非就是这样的。
内存泄漏是如何产生的呢?
1、发送一个没有接受者的channel
1func query() int {
2n := rand.Intn(100)
3time.Sleep(time.Duration(n) * time.Millisecond)
4return n
5}
6
7func queryAll() int {
8ch := make(chan int)
9go func() { ch <- query() }()
10go func() { ch <- query() }()
11go func() { ch <- query() }()
12return <-ch
13}
14
15func main() {
16for i := 0; i < 4; i++ {
17queryAll()
18fmt.Printf("#goroutines: %d", runtime.NumGoroutine())
19}
20}
输出:
1#goroutines: 3
2#goroutines: 5
3#goroutines: 7
4#goroutines: 9
每次调用 queryAll 后,goroutine 的数目会发生增长。问题在于,在接收到第一个响应后,“较慢的” goroutine 将会发送到另一端没有接收者的 channel 中。
2、nil channel
写入到nil channel会永远阻塞
1package main
2
3func main() {
4var ch chan struct{}
5ch <- struct{}{}
6}
所以它导致死锁:
1fatal error: all goroutines are asleep - deadlock!
2
3goroutine 1 [chan send (nil chan)]:
4main.main()
5...
当从 nil channel 读取数据时,同样的事情发生了:
var ch chan struct{}
<-ch
传递尚未初始化的channel,也可能发生
1func main() {
2var ch chan int
3if false {
4ch = make(chan int, 1)
5ch <- 1
6}
7go func(ch chan int) {
8<-ch
9}(ch)
10
11c := time.Tick(1 * time.Second)
12for range c {
13fmt.Printf("#goroutines: %d", runtime.NumGoroutine())
14}
15}
3、channel通讯超时
如果goroutine在通讯的时候,发送端的channel由于某种原因没有到达消费端的goroutine,那么下游消费的goroutine就会长时间处于阻塞的状态等待消息的唤醒。
1/*
2检查channel读写超时,并做超时的处理
3*/
4func testTimeout() {
5g := make(chan int)
6quit := make(chan bool)
7
8go func() {
9for {
10select {
11case v := <-g:
12fmt.Println(v)
13case <-time.After(time.Second * time.Duration(3)):
14quit <- true
15fmt.Println("超时,通知主线程退出")
16return
17}
18}
19}()
20
21for i := 0; i < 3; i++ {
22g <- i
23}
24
25<-quit
26fmt.Println("收到退出通知,主线程退出")
27}
二,如何排查内存的泄漏
我们可以使用pprof进行排查
那我们就来了解下pprof的基本知识点
什么是pprof
pprof是Go的性能分析工具,在程序运行过程中,可以记录程序的运行信息,可以是CPU使用情况、内存使用情况、goroutine运行情况等,当需要性能调优或者定位Bug时候,这些记录的信息是相当重要。
基本使用
使用pprof有多种方式,Go已经现成封装好了1个:net/http/pprof,使用简单的几行命令,就可以开启pprof,记录运行信息,并且提供了Web服务,能够通过浏览器和命令行2种方式获取运行数据。
1import (
2"fmt"
3"net/http"
4_ "net/http/pprof"
5)
6
7func main() {
8// 开启pprof,监听请求
9ip := "127.0.0.1:6060"
10if err := http.ListenAndServe(ip, nil); err != nil {
11fmt.Printf("start pprof failed on %s\n", ip)
12}
13}
我们输入ip:port/debug/pprof/打开pprof主页
例如我的地址
http://127.0.0.1:6060/debug/pprof/
会看到下面的信息
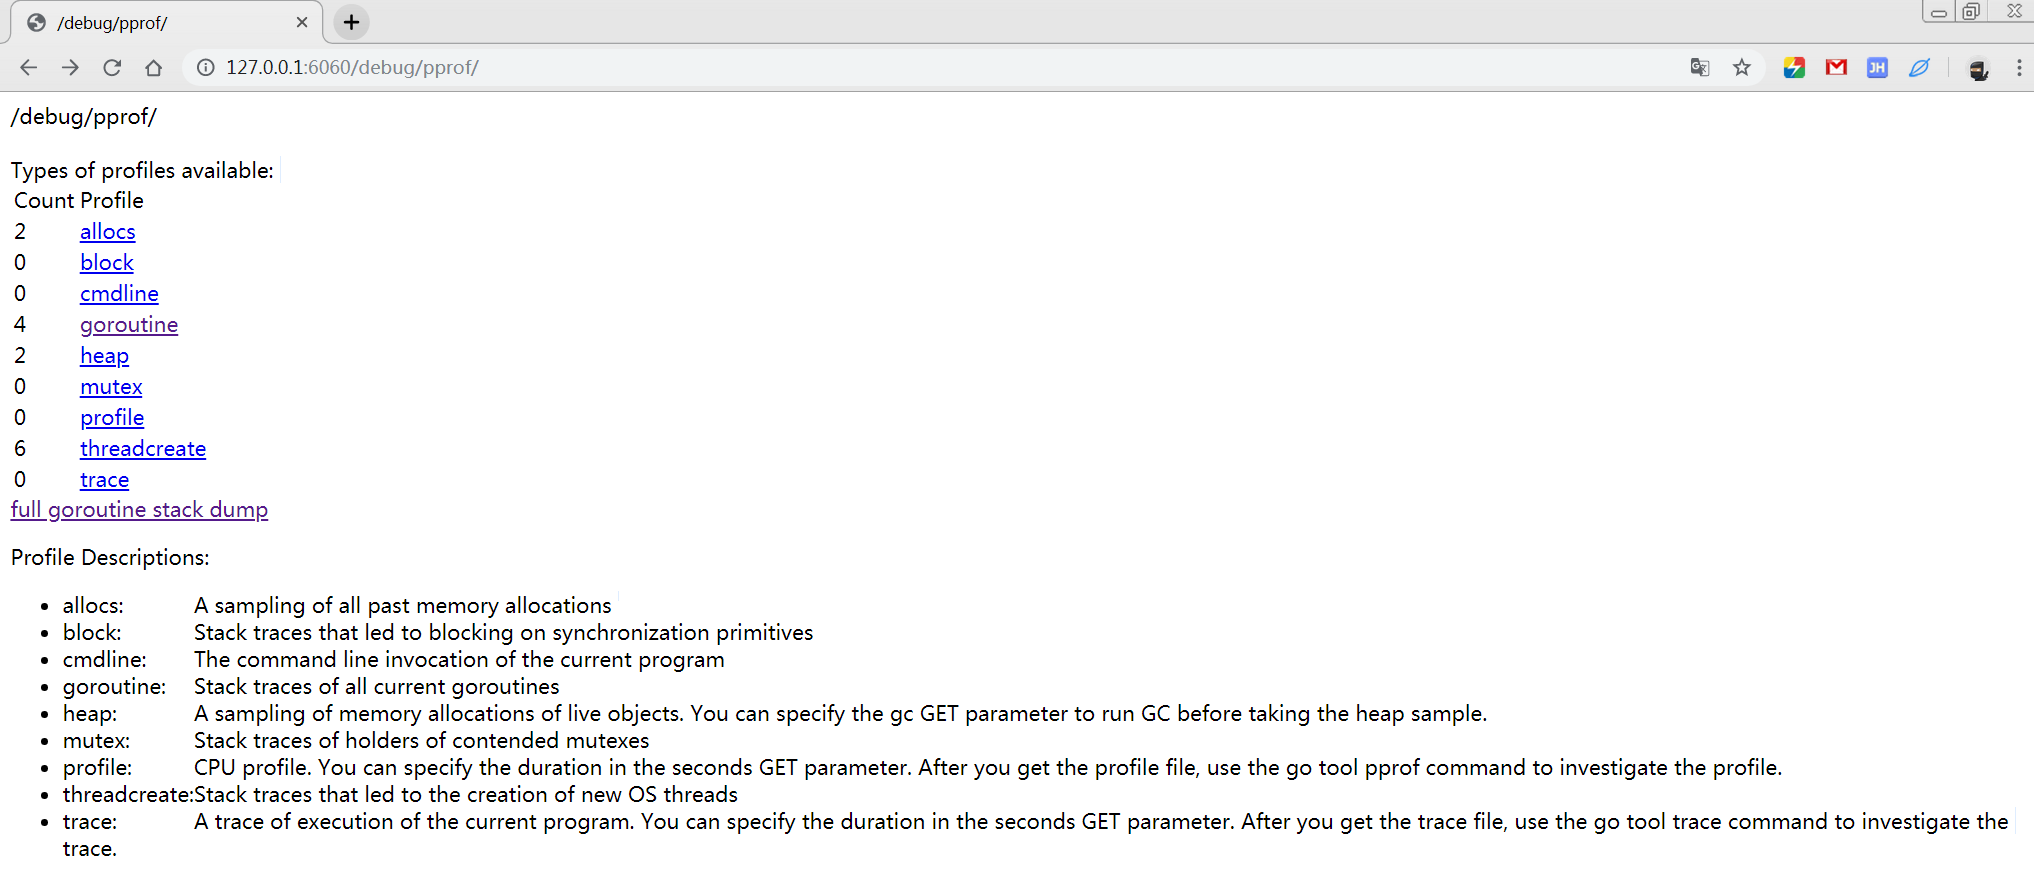
下面来分析一下上面的具体参数的意思
1allocs:
2A sampling of all past memory allocations
3所有过去内存分配的采样
4block:
5Stack traces that led to blocking on synchronization primitives
6导致同步原语阻塞的堆栈跟踪
7cmdline:
8The command line invocation of the current program
9当前程序的命令行调用
10
11goroutine:
12Stack traces of all current goroutines
13heap:
14A sampling of memory allocations of live objects. You can specify the gc GET parameter to run GC before taking the heap sample.
15活动对象内存分配的采样。在获取堆样本之前,可以指定gc get参数来运行gc。(也就是堆内存的信息)
16mutex:
17Stack traces of holders of contended mutexes
18争用互斥锁持有者的堆栈跟踪(锁的信息)
19profile:
20CPU profile. You can specify the duration in the seconds GET parameter. After you get the profile file, use the go tool pprof command to investigate the profile.
21CPU配置文件。可以在seconds get参数中指定持续时间。获取配置文件后,使用go tool pprof命令调查配置文件。
22threadcreate:
23Stack traces that led to the creation of new OS threads
24导致创建新操作系统线程的堆栈跟踪(线程的信息)
25trace:
26A trace of execution of the current program. You can specify the duration in the seconds GET parameter. After you get the trace file, use the go tool trace command to investigate the trace.
27对当前程序执行的跟踪。可以在seconds get参数中指定持续时间。获取跟踪文件后,使用go tool trace命令调查跟踪。
命令行方式
当连接在服务器终端上的时候,是没有浏览器可以使用的,Go提供了命令行的方式,能够获取以上5类信息,这种方式用起来更方便。
使用命令go tool pprof url可以获取指定的profile文件,此命令会发起http请求,然后下载数据到本地,之后进入交互式模式,就像gdb一样,可以使用命令查看运行信息,以下是5类请求的方式:
1# 下载cpu profile,默认从当前开始收集30s的cpu使用情况,需要等待30s
2go tool pprof http://localhost:6060/debug/pprof/profile # 30-second CPU profile
3go tool pprof http://localhost:6060/debug/pprof/profile?seconds=120 # wait 120s
4
5# 下载heap profile
6go tool pprof http://localhost:6060/debug/pprof/heap # heap profile
7
8# 下载goroutine profile
9go tool pprof http://localhost:6060/debug/pprof/goroutine # goroutine profile
10
11# 下载block profile
12go tool pprof http://localhost:6060/debug/pprof/block # goroutine blocking profile
13
14# 下载mutex profile
15go tool pprof http://localhost:6060/debug/pprof/mutex
内存泄露的发现
如果使用云平台部署Go程序,云平台都提供了内存查看的工具,可以查看OS的内存占用情况和某个进程的内存占用情况,比如阿里云,我们在1个云主机上只部署了1个Go服务,所以OS的内存占用情况,基本是也反映了进程内存占用情况,OS内存占用情况如下,可以看到随着时间的推进,内存的占用率在不断的提高,这是内存泄露的最明显现象:
怎么用heap发现内存问题
使用pprof的heap能够获取程序运行时的内存信息,在程序平稳运行的情况下,每个一段时间使用heap获取内存的profile,然后使用base能够对比两个profile文件的差别,就像diff命令一样显示出增加和减少的变化,使用一个简单的demo来说明heap和base的使用,依然使用demo2进行展示。
1// 展示内存增长和pprof,并不是泄露
2package main
3
4import (
5"fmt"
6"net/http"
7_ "net/http/pprof"
8"os"
9"time"
10)
11
12// 运行一段时间:fatal error: runtime: out of memory
13func main() {
14// 开启pprof
15go func() {
16ip := "0.0.0.0:6060"
17if err := http.ListenAndServe(ip, nil); err != nil {
18fmt.Printf("start pprof failed on %s\n", ip)
19os.Exit(1)
20}
21}()
22
23tick := time.Tick(time.Second / 100)
24var buf []byte
25for range tick {
26buf = append(buf, make([]byte, 1024*1024)...)
27}
28}
将上面代码运行起来,执行以下命令获取profile文件,1分钟后再获取1次。
go tool pprof http://localhost:6060/debug/pprof/heap
我已经获取到了两个profile文件:
1Administrator@SC-201807230940 MINGW64 ~/pprof
2$ ls
3pprof.alloc_objects.alloc_space.inuse_objects.inuse_space.001.pb.gz
4pprof.alloc_objects.alloc_space.inuse_objects.inuse_space.002.pb.gz
使用base把001文件作为基准,然后用002和001对比,先执行top看top的对比,然后执行list main列出main函数的内存对比,结果如下:
1Administrator@SC-201807230940 MINGW64 ~/pprof
2$ go tool pprof -base pprof.alloc_objects.alloc_space.inuse_objects.inuse_space.001.pb.gz pprof.alloc_objects.alloc_space.inuse_objects.inuse_space.002.pb.gz
结果
1(pprof) top
2Showing nodes accounting for 1.04GB, 50.58% of 2.06GB total
3flat flat% sum% cum cum%
41.04GB 50.58% 50.58% 1.04GB 50.58% main.main
50 0% 50.58% 1.04GB 50.58% runtime.main
6(pprof)
使用traces
1Type: inuse_space
2Time: Jul 29, 2019 at 8:48am (CST)
3-----------+-------------------------------------------------------
4bytes: 1.55GB
51.55GB main.main
6runtime.main
7-----------+-------------------------------------------------------
8bytes: 1.24GB
90 main.main
10runtime.main
11-----------+-------------------------------------------------------
12bytes: 1016.83MB
130 main.main
14runtime.main
15-----------+-------------------------------------------------------
16bytes: 813.46MB
170 main.main
18runtime.main
19-----------+-------------------------------------------------------
20bytes: 902.59kB
210 compress/flate.NewWriter
22compress/gzip.(*Writer).Write
23runtime/pprof.(*profileBuilder).build
24runtime/pprof.writeHeapProto
25runtime/pprof.writeHeap
26runtime/pprof.(*Profile).WriteTo
27net/http/pprof.handler.ServeHTTP
28net/http/pprof.Index
29net/http.HandlerFunc.ServeHTTP
30net/http.(*ServeMux).ServeHTTP
31net/http.serverHandler.ServeHTTP
32net/http.(*conn).serve
33-----------+-------------------------------------------------------
34bytes: 650.77MB
350 main.main
36runtime.main
37-----------+-------------------------------------------------------
38bytes: 520.61MB
390 main.main
40runtime.main
41-----------+-------------------------------------------------------
42bytes: 416.48MB
430 main.main
44runtime.main
45-----------+-------------------------------------------------------
46bytes: 333.19MB
470 main.main
48runtime.main
49-----------+-------------------------------------------------------
50bytes: 266.55MB
510 main.main
52runtime.main
53-----------+-------------------------------------------------------
54bytes: 213.23MB
550 main.main
56runtime.main
57-----------+-------------------------------------------------------
58bytes: 170.59MB
590 main.main
60runtime.main
61-----------+-------------------------------------------------------
62bytes: 136.47MB
630 main.main
64runtime.main
65-----------+-------------------------------------------------------
66bytes: 109.17MB
670 main.main
68runtime.main
69-----------+-------------------------------------------------------
70bytes: 87.34MB
710 main.main
72runtime.main
73-----------+-------------------------------------------------------
74bytes: 69.87MB
750 main.main
76runtime.main
77-----------+-------------------------------------------------------
78bytes: 55.89MB
790 main.main
80runtime.main
81-----------+-------------------------------------------------------
82bytes: 44.71MB
830 main.main
84runtime.main
85-----------+-------------------------------------------------------
86bytes: 35.77MB
870 main.main
88runtime.main
89-----------+-------------------------------------------------------
90bytes: 28.61MB
910 main.main
92runtime.main
93-----------+-------------------------------------------------------
94bytes: 22.88MB
950 main.main
96runtime.main
97-----------+-------------------------------------------------------
98bytes: 18.30MB
990 main.main
100runtime.main
101-----------+-------------------------------------------------------
102bytes: 14.64MB
1030 main.main
104runtime.main
105-----------+-------------------------------------------------------
106bytes: 11.71MB
1070 main.main
108runtime.main
109-----------+-------------------------------------------------------
110bytes: 9.37MB
1110 main.main
112runtime.main
113-----------+-------------------------------------------------------
114bytes: 7.49MB
1150 main.main
116runtime.main
117-----------+-------------------------------------------------------
118bytes: 5.99MB
1190 main.main
120runtime.main
121-----------+-------------------------------------------------------
122bytes: 4.79MB
1230 main.main
124runtime.main
125-----------+-------------------------------------------------------
126bytes: 3.07MB
1270 main.main
128runtime.main
129-----------+-------------------------------------------------------
130bytes: 2.46MB
1310 main.main
132runtime.main
133-----------+-------------------------------------------------------
134bytes: 1.16MB
1350 main.main
136runtime.main
137-----------+-------------------------------------------------------
138bytes: 1MB
1391.16MB main.main
140runtime.main
141-----------+-------------------------------------------------------
142bytes: 520.61MB
143-520.61MB main.main
144runtime.main
145-----------+-------------------------------------------------------
146bytes: 416.48MB
1470 main.main
148runtime.main
149-----------+-------------------------------------------------------
150bytes: 333.19MB
1510 main.main
152runtime.main
153-----------+-------------------------------------------------------
154bytes: 266.55MB
1550 main.main
156runtime.main
157-----------+-------------------------------------------------------
158bytes: 213.23MB
1590 main.main
160runtime.main
161-----------+-------------------------------------------------------
162bytes: 170.59MB
1630 main.main
164runtime.main
165-----------+-------------------------------------------------------
166bytes: 136.47MB
1670 main.main
168runtime.main
169-----------+-------------------------------------------------------
170bytes: 109.17MB
1710 main.main
172runtime.main
173-----------+-------------------------------------------------------
174bytes: 87.34MB
1750 main.main
176runtime.main
177-----------+-------------------------------------------------------
178bytes: 69.87MB
1790 main.main
180runtime.main
181-----------+-------------------------------------------------------
182bytes: 55.89MB
1830 main.main
184runtime.main
185-----------+-------------------------------------------------------
186bytes: 44.71MB
1870 main.main
188runtime.main
189-----------+-------------------------------------------------------
190bytes: 35.77MB
1910 main.main
192runtime.main
193-----------+-------------------------------------------------------
194bytes: 28.61MB
1950 main.main
196runtime.main
197-----------+-------------------------------------------------------
198bytes: 22.88MB
1990 main.main
200runtime.main
201-----------+-------------------------------------------------------
202bytes: 18.30MB
2030 main.main
204runtime.main
205-----------+-------------------------------------------------------
206bytes: 14.64MB
2070 main.main
208runtime.main
209-----------+-------------------------------------------------------
210bytes: 11.71MB
2110 main.main
212runtime.main
213-----------+-------------------------------------------------------
214bytes: 9.37MB
2150 main.main
216runtime.main
217-----------+-------------------------------------------------------
218bytes: 7.49MB
2190 main.main
220runtime.main
221-----------+-------------------------------------------------------
222bytes: 5.99MB
2230 main.main
224runtime.main
225-----------+-------------------------------------------------------
226bytes: 4.79MB
2270 main.main
228runtime.main
229-----------+-------------------------------------------------------
230bytes: 3.07MB
2310 main.main
232runtime.main
233-----------+-------------------------------------------------------
234bytes: 2.46MB
2350 main.main
236runtime.main
237-----------+-------------------------------------------------------
238bytes: 1.16MB
2390 main.main
240runtime.main
241-----------+-------------------------------------------------------
242bytes: 1MB
243-1.16MB main.main
244runtime.main
245-----------+-------------------------------------------------------
246(pprof)
247
248使用list
249
250(pprof) list main.main
251Total: 2.06GB
252ROUTINE ======================== main.main in D:\gowork\src\study\main\main.go
2531.04GB 1.04GB (flat, cum) 50.58% of Total
254. . 57: }()
255. . 58:
256. . 59: tick := time.Tick(time.Second / 100)
257. . 60: var buf []byte
258. . 61: for range tick {
2591.04GB 1.04GB 62: buf = append(buf, make([]byte, 1024*1024)...)
260. . 63: }
261. . 64:}
262. . 65:
263. . 66:
264. . 67:
265(pprof)
heap“不能”定位内存泄露
heap能显示内存的分配情况,以及哪行代码占用了多少内存,我们能轻易的找到占用内存最多的地方,如果这个地方的数值还在不断怎大,基本可以认定这里就是内存泄露的位置。
曾想按图索骥,从内存泄露的位置,根据调用栈向上查找,总能找到内存泄露的原因,这种方案看起来是不错的,但实施起来却找不到内存泄露的原因,结果是事半功倍。
原因在于一个Go程序,其中有大量的goroutine,这其中的调用关系也许有点复杂,也许内存泄露是在某个三方包里。举个栗子,比如下面这幅图,每个椭圆代表1个goroutine,其中的数字为编号,箭头代表调用关系。heap profile显示g111(最下方标红节点)这个协程的代码出现了泄露,任何一个从g101到g111的调用路径都可能造成了g111的内存泄露,有2类可能:
该goroutine只调用了少数几次,但消耗了大量的内存,说明每个goroutine调用都消耗了不少内存,内存泄露的原因基本就在该协程内部。
该goroutine的调用次数非常多,虽然每个协程调用过程中消耗的内存不多,但该调用路径上,协程数量巨大,造成消耗大量的内存,并且这些goroutine由于某种原因无法退出,占用的内存不会释放,内存泄露的原因在到g111调用路径上某段代码实现有问题,造成创建了大量的g111。
第2种情况,就是goroutine泄露,这是通过heap无法发现的,所以heap在定位内存泄露这件事上,发挥的作用不大。
内存泄露的排查
Web可视化查看
Web方式适合web服务器的端口能访问的情况,使用起来方便,有2种方式:
查看某条调用路径上,当前阻塞在此goroutine的数量
查看所有goroutine的运行栈(调用路径),可以显示阻塞在此的时间
1import (
2"fmt"
3"net/http"
4_ "net/http/pprof"
5"os"
6"time"
7)
8
9func main() {
10// 开启pprof
11go func() {
12ip := "0.0.0.0:6060"
13if err := http.ListenAndServe(ip, nil); err != nil {
14fmt.Printf("start pprof failed on %s\n", ip)
15os.Exit(1)
16}
17}()
18outCh := make(chan int)
19for i := 1; i <= 5; i++ {
20go func() {
21outCh <- 1
22}()
23time.Sleep(time.Second)
24}
25
26///value := <-outCh
27//fmt.Println("value : ", value)
28//time
29time.Sleep(100 * time.Second)
30}
方式一
url请求中设置debug=1:
使用http://127.0.0.1:6060/debug/pprof/goroutine?debug=1
我们可以明显的看到有5个goroutine被阻塞了
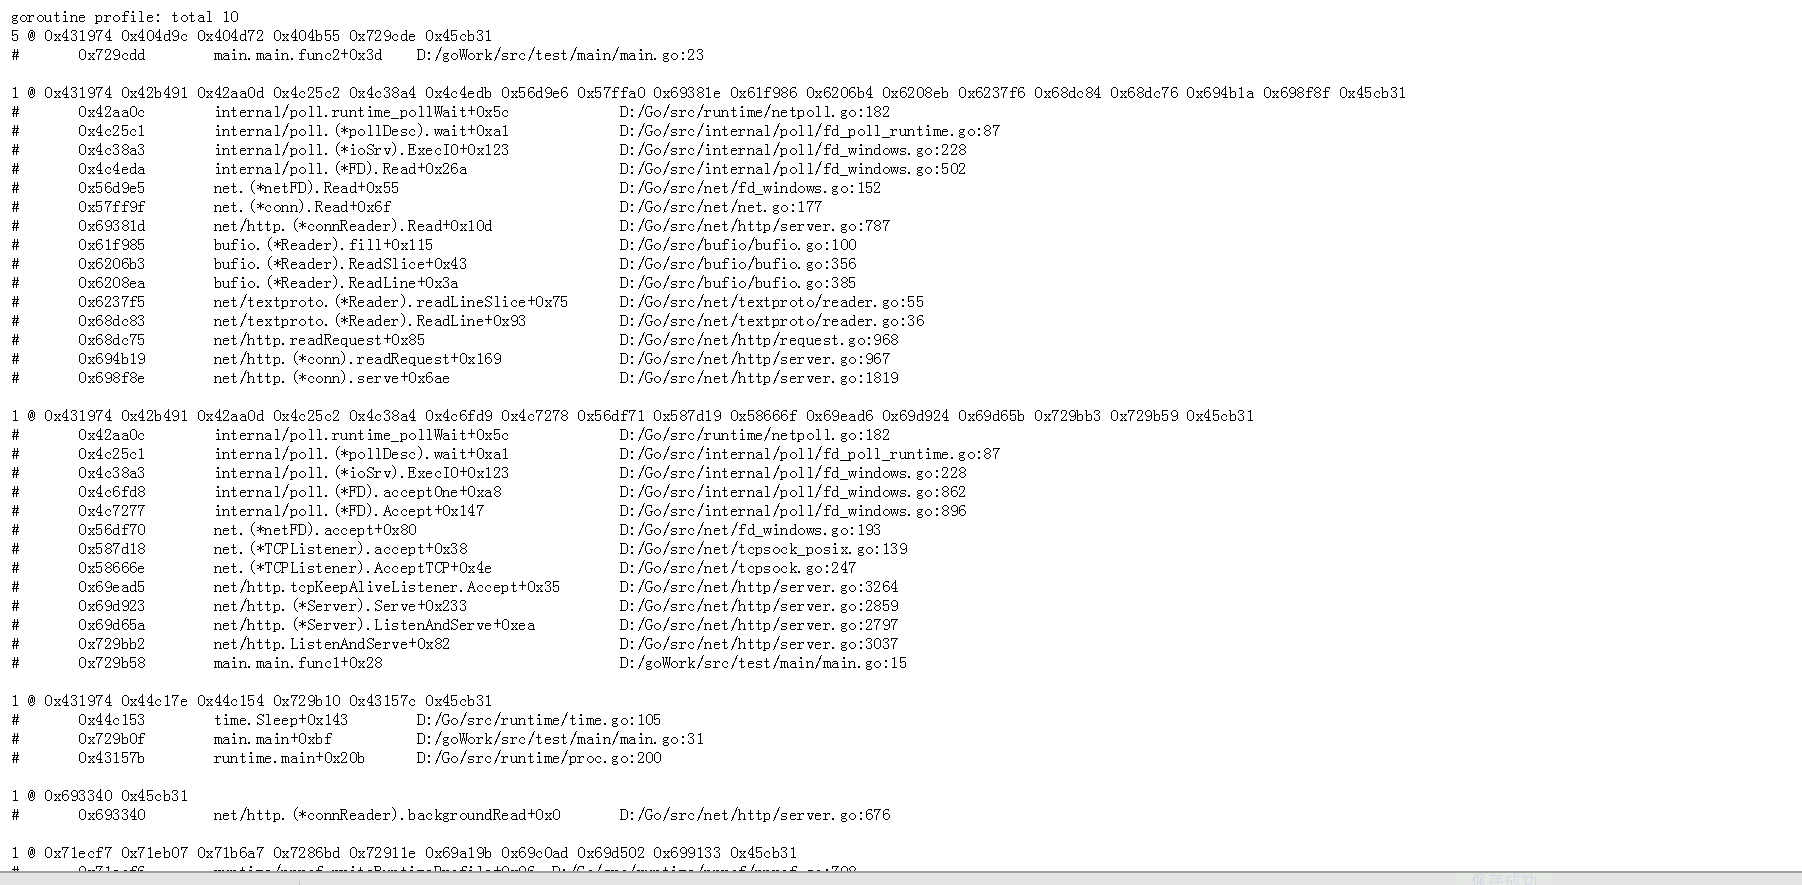
其实应该是5个地方主goroutine应为时间也是被阻塞掉了

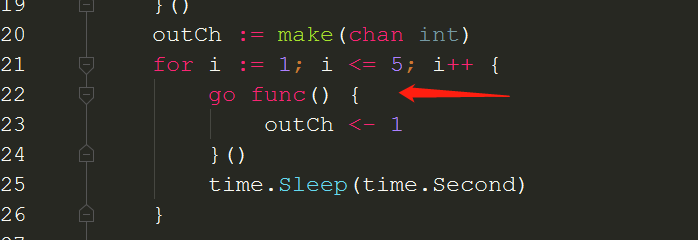
我们看到有5个goroutine被同一个资源阻塞掉了,并且指向的代码块是23行,那么我们就能很快的进行定位排查。
方式二
url请求中设置debug=2:
使用:http://127.0.0.1:6060/debug/pprof/goroutine?debug=2

我们可以看到阻塞的时间,同时也能看到阻塞的代码块
命令行交互式方法
top会列出5个统计数据:
flat: 本函数占用的内存量。
flat%: 本函数内存占使用中内存总量的百分比。
sum%: 前面每一行flat百分比的和,比如第2行虽然的100% 是 100% + 0%。
cum: 是累计量,加入main函数调用了函数f,函数f占用的内存量,也会记进来。
cum%: 是累计量占总量的百分比。
list
查看某个函数的代码,以及该函数每行代码的指标信息,如果函数名不明确,会进行模糊匹配,比如list main会列出main.main和runtime.main。
traces
打印所有调用栈,以及调用栈的指标信息。
下面是具体的排查流程
1、使用top
1$ go tool pprof http://0.0.0.0:6060/debug/pprof/goroutine
2Fetching profile over HTTP from http://0.0.0.0:6060/debug/pprof/goroutine
3Saved profile in C:\Users\Administrator\pprof\pprof.goroutine.006.pb.gz
4Type: goroutine
5Time: Jul 29, 2019 at 8:06am (CST)
6Entering interactive mode (type "help" for commands, "o" for options)
7(pprof) top
8Unrecognized command: "\x1b[A\x1b[Btop"
9(pprof) top
10Showing nodes accounting for 9, 100% of 9 total
11Showing top 10 nodes out of 32
12flat flat% sum% cum cum%
137 77.78% 77.78% 7 77.78% runtime.gopark
141 11.11% 88.89% 1 11.11% net/http.(*connReader).backgroundRead
151 11.11% 100% 1 11.11% runtime/pprof.writeRuntimeProfile
160 0% 100% 1 11.11% internal/poll.(*FD).Accept
170 0% 100% 1 11.11% internal/poll.(*FD).acceptOne
180 0% 100% 1 11.11% internal/poll.(*ioSrv).ExecIO
190 0% 100% 1 11.11% internal/poll.(*pollDesc).wait
200 0% 100% 1 11.11% internal/poll.runtime_pollWait
210 0% 100% 1 11.11% main.main
220 0% 100% 1 11.11% main.main.func1
23(pprof)
我们可以看到有7个被阻塞了
我们通过traces打印出具体的调用链路
1(pprof) traces
2Type: goroutine
3Time: Jul 29, 2019 at 8:06am (CST)
4-----------+-------------------------------------------------------
55 runtime.gopark
6runtime.goparkunlock
7runtime.chansend
8runtime.chansend1
9main.main.func2
10-----------+-------------------------------------------------------
111 runtime.gopark
12runtime.netpollblock
13internal/poll.runtime_pollWait
14internal/poll.(*pollDesc).wait
15internal/poll.(*ioSrv).ExecIO
16internal/poll.(*FD).acceptOne
17internal/poll.(*FD).Accept
18net.(*netFD).accept
19net.(*TCPListener).accept
20net.(*TCPListener).AcceptTCP
21net/http.tcpKeepAliveListener.Accept
22net/http.(*Server).Serve
23net/http.(*Server).ListenAndServe
24net/http.ListenAndServe
25main.main.func1
26-----------+-------------------------------------------------------
271 runtime.gopark
28runtime.goparkunlock
29time.Sleep
30main.main
31runtime.main
32-----------+-------------------------------------------------------
331 net/http.(*connReader).backgroundRead
34-----------+-------------------------------------------------------
351 runtime/pprof.writeRuntimeProfile
36runtime/pprof.writeGoroutine
37runtime/pprof.(*Profile).WriteTo
38net/http/pprof.handler.ServeHTTP
39net/http/pprof.Index
40net/http.HandlerFunc.ServeHTTP
41net/http.(*ServeMux).ServeHTTP
42net/http.serverHandler.ServeHTTP
43net/http.(*conn).serve
44-----------+-------------------------------------------------------
45(pprof)
我们可以看到5个被阻塞到了 main.main.func2
然后我们可以使用list查看具体代码的阻塞
1(pprof) list main.main.func2
2Total: 9
3ROUTINE ======================== main.main.func2 in D:\gowork\src\study\main\main.go
40 5 (flat, cum) 55.56% of Total
5. . 29: }
6. . 30: }()
7. . 31: outCh := make(chan int)
8. . 32: for i := 1; i <= 5; i++ {
9. . 33: go func() {
10. 5 34: outCh <- 1
11. . 35: }()
12. . 36: time.Sleep(time.Second)
13. . 37: }
14. . 38:
15. . 39: ///value := <-outCh
16(pprof)
我们可以看到已经将我们的代码阻塞块给打印出来了,我们就能很好的进行排查了。
参考:https://studygolang.com/articles/20529