
开场段子 :
记得当年我查到高考分数后, 第一件事不是告诉父母,而是飞快地跑到学校。
找到班主任,指着她说: “哼哼,你不是说以我的智商不可能考上一本的吗?”
班主任一脸尴尬地向我道歉。
我气愤地说: “还真被你这个乌鸦嘴说中了!”
全国名校众多,最常听说的是“985工程”高校、“211工程”高校。除此之外还有“双一流”高校的说法,这是在2017年提出来的。在这里我们介绍“211”高校。
何为211高校
“211”工程,即面向21世纪、重点建设100所左右的高等学校和一批重点学科的建设工程,新中国成立以来由国家立项在高等教育领域进行的规模最大、层次最高的重点建设工作,是中国政府实施“科教兴国”战略的重大举措,211大学在社会上认可度也极高。
由于当时各大高校之间竞争激烈,虽说只是100所,但是到了今天已经发展成了116所,目前已经不接受申报了。
这些211高校包括39所985高校,以及另外77所高校。可以分成6个梯队。
第一梯度为前五的清华大学、北京大学、复旦大学、浙江大学、上海交通大学。
第二梯度为前二十的“985”高校,分别是中国科学技术大学、中国人民大学、南京大学、同济大学、南开大学、北京航空航天大学、北京师范大学、武汉大学、西安交通大学、天津大学、华中科技大学、北京理工大学、东南大学、中山大学、华东师范大学、哈尔滨工业大学、厦门大学、中南大学、华南理工大学、电子科技大学。
第三梯度为其他十三所高校以及国防科技大学。它们分别是西北工业大学、大连理工大学、四川大学、吉林大学、湖南大学、重庆大学、山东大学、中国农业大学、中国海洋大学、中央民族大学、东北大学、兰州大学、西北农林科技大学。
以上为39所985高校,同时它们也是211高校。
第四梯度的有上海财经大学、中央财经大学、对外经济贸易大学、北京外国语大学、中国政法大学、北京邮电大学、上海外国语大学、西南财经大学、中国传媒大学、中南财经政法大学、南京航空航天大学、北京科技大学、北京交通大学、华东理工大学、西安电子科技大学、天津医科大学、南京理工大学、华中师范大学、哈尔滨工程大学、华北电力大学、北京中医药大学、暨南大学、苏州大学、武汉理工大学。
第五梯度的有中国药科大学、东华大学、河海大学、北京林业大学、河北工业大学、北京工业大学、江南大学、北京化工大学、西南交通大学、上海大学、南京师范大学、中国地质大学(武汉)、中国地质大学(北京)、西北大学、东北师范大学、长安大学、中国矿业大学(北京)、华中农业大学、合肥工业大学、广西大学、中国石油大学(华东)、陕西师范大学、南京农业大学。
第六梯度的有湖南师范大学、福州大学、大连海事大学、西南大学、中国矿业大学、云南大学、太原理工大学、华南师范大学、北京体育大学、中国石油大学(北京)、安徽大学、东北林业大学、东北农业大学、辽宁大学、南昌大学、延边大学、内蒙古大学、四川农业大学、海南大学、贵州大学、郑州大学、新疆大学、宁夏大学、石河子大学、青海大学、中央音乐学院、西藏大学、第二军医大学、第四军医大学。
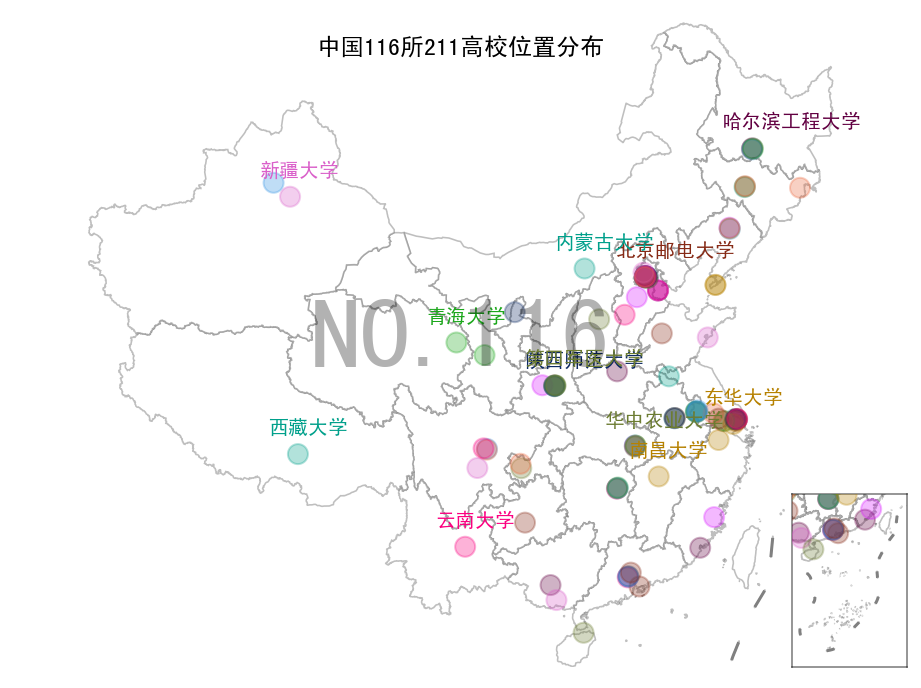
那么这116所211大学都在哪里呢?我们用Python动态图来盘点一下吧!
先上图片
再上视频
最后上代码
1import numpy as np
2import pandas as pd
3import geopandas as gpd
4import shapely
5from shapely import geometry as geo
6from shapely import wkt
7import geopandas as gpd
8import matplotlib.pyplot as plt
9import matplotlib.animation as  animation
10import contextily as ctx
11
12import imageio
13import os
14from PIL import Image
15
16plt.rcParams['font.family'] = 'sans-serif'
17plt.rcParams['font.sans-serif'] = ['SimHei']
18plt.rcParams['axes.unicode_minus'] = False
19plt.rcParams['animation.writer'] = 'html'
20plt.rcParams['animation.embed_limit'] = 100
21
22def rgba_to_rgb(img_rgba):
23    img_rgb = Image.new("RGB", img_rgba.size, (255, 255, 255))
24    img_rgb.paste(img_rgba, mask=img_rgba.split()[3])
25    return img_rgb
26
27def html_to_gif(html_file, gif_file, duration=0.5):
28    path = html_file.replace(".html","_frames")
29    images = [os.path.join(path,x) for x in sorted(os.listdir(path))]
30    frames = [imageio.imread(x) for x in images]
31    if frames[0].shape[-1]==4:
32        frames = [np.array(rgba_to_rgb(Image.fromarray(x))) for x in frames]
33    imageio.mimsave(gif_file, frames, 'gif', duration=duration)
34    return gif_file
35
36cmap = [
37'#2E91E5',
38'#1CA71C',
39'#DA16FF',
40'#B68100',
41'#EB663B',
42'#00A08B',
43'#FC0080',
44'#6C7C32',
45'#862A16',
46'#620042',
47'#DA60CA',
48'#0D2A63']*100
49
50def getCoords(geom):
51    if isinstance(geom,geo.MultiPolygon):
52        return [np.array(g.exterior) for g in geom.geoms]
53    elif isinstance(geom,geo.Polygon):
54        return [np.array(geom.exterior)]
55    elif isinstance(geom,geo.LineString):
56        return [np.array(geom)]
57    elif isinstance(geom,geo.MultiLineString):
58        return [np.array(x) for x in list(geom.geoms)]
59    else:
60        raise Exception("geom must be one of [polygon,MultiPolygon,LineString,MultiLineString]!")
61
62#底图数据
63dfprovince = gpd.read_file("./data/dfprovince.geojson").set_crs("epsg:4326").to_crs("epsg:2343")
64dfnanhai = gpd.read_file("./data/dfnanhai.geojson").set_crs("epsg:4326").to_crs("epsg:2343")
65dfline9 =  dfnanhai[(dfnanhai["LENGTH"]>1.0)&(dfnanhai["LENGTH"]<2.0)]
66
67#散点数据
68df985 = gpd.read_file("./data/中国985大学.geojson").set_crs("epsg:4326").to_crs("epsg:2343")
69df211 = gpd.read_file("./data/中国211大学.geojson").set_crs("epsg:4326").to_crs("epsg:2343")
70dfpoints = pd.concat([df985,df211],axis = 0)
71df = pd.DataFrame({"x":[pt.x for pt in dfpoints["geometry"]],
72                  "y": [pt.y for pt in dfpoints["geometry"]]})
73df["z"] = 1.0
74df.index = dfpoints["name"].values
75
76def bubble_map_dance(df,title = "中国116所211高校位置分布",
77                     filename = None,
78                     figsize = (8,6),dpi = 144,
79                     duration = 0.5,
80                     anotate_points = ["北京邮电大学","南昌大学","华中农业大学","东华大学","云南大学",
81                     "陕西师范大学","内蒙古大学","西藏大学","新疆大学","青海大学","哈尔滨工程大学"]):
82
83    fig, ax_base =plt.subplots(figsize=figsize,dpi=dpi)
84    ax_child=fig.add_axes([0.800,0.125,0.10,0.20])
85
86    def plot_frame(i):
87
88            ax_base.clear()
89            ax_child.clear()
90
91            #============================================================
92            #绘制底图
93            #============================================================
94
95            #绘制省边界
96            polygons = [getCoords(x) for x in dfprovince["geometry"]]
97            for j,coords in enumerate(polygons):
98                for x in coords:
99                    poly = plt.Polygon(x, fill=True, ec = "gray", fc = "white",alpha=0.5,linewidth=.8)
100                    poly_child = plt.Polygon(x, fill=True, ec = "gray", fc = "white",alpha=0.5,linewidth=.8)
101                    ax_base.add_patch(poly)
102                    ax_child.add_patch(poly_child )
103
104            #绘制九段线
105            coords = [getCoords(x) for x in dfline9["geometry"]]
106            lines = [y for x in coords for y in x ]
107            for ln in lines:
108                x, y = np.transpose(ln)
109                line = plt.Line2D(x,y,color="gray",linestyle="-.",linewidth=1.5)
110                line_child = plt.Line2D(x,y,color="gray",linestyle="-.",linewidth=1.5)
111                ax_base.add_artist(line)
112                ax_child.add_artist(line_child)
113
114
115
116            #设置spine格式
117            for spine in['top','left',"bottom","right"]:
118                ax_base.spines[spine].set_color("none")
119                ax_child.spines[spine].set_alpha(0.5)
120            ax_base.axis("off")
121
122
123            #设置绘图范围
124            bounds = dfprovince.total_bounds
125            ax_base.set_xlim(bounds[0]-(bounds[2]-bounds[0])/10, bounds[2]+(bounds[2]-bounds[0])/10)
126            ax_base.set_ylim(bounds[1]+(bounds[3]-bounds[1])/3.5, bounds[3]+(bounds[3]-bounds[1])/100)
127
128            ax_child.set_xlim(bounds[2]-(bounds[2]-bounds[0])/2.5, bounds[2]-(bounds[2]-bounds[0])/20)
129            ax_child.set_ylim(bounds[1]-(bounds[3]-bounds[1])/20, bounds[1]+(bounds[3]-bounds[1])/2)
130
131            #移除坐标轴刻度
132            ax_child.set_xticks([]);
133            ax_child.set_yticks([]);
134
135            #============================================================
136            #绘制散点
137            #============================================================
138
139            k = i//3+1
140            m = i%3
141            text = "NO."+str(k)
142
143            dfdata = df.iloc[:k,:].copy()
144            dftmp = df.iloc[:k-1,:].copy()
145
146            # 绘制散点图像
147            if len(dftmp)>0:
148                ax_base.scatter(dftmp["x"],dftmp["y"],s = 100*dftmp["z"]/df["z"].mean(),
149                       c = (cmap*100)[0:len(dftmp)],alpha = 0.3,zorder = 3)
150                ax_child.scatter(dftmp["x"],dftmp["y"],s = 100*dftmp["z"]/df["z"].mean(),
151                       c = (cmap*100)[0:len(dftmp)],alpha = 0.3,zorder = 3)
152
153                # 添加注释文字
154                for i,p in enumerate(dftmp.index):
155                    px,py,pz = dftmp.loc[p,["x","y","z"]].tolist()
156                    if p in anotate_points:
157                        ax_base.annotate(p,xy = (px,py),  xycoords = "data",xytext = (-15,10),
158                        fontsize = 10,fontweight = "bold",color = cmap[i], textcoords = "offset points")
159
160            # 添加标题和排名序号
161            #ax_base.set_title(title,color = "black",fontsize = 12)
162            ax_base.text(0.5, 0.95, title, va="center", ha="center",
163                        size = 12,transform = ax_base.transAxes)
164            ax_base.text(0.5, 0.5, text, va="center", ha="center",
165                         alpha=0.3, size = 50,transform = ax_base.transAxes)
166
167            # 添加注意力动画
168            if m==0:
169                px,py,pz = dfdata["x"][[-1]],dfdata["y"][[-1]],dfdata["z"][-1]
170                p = dfdata.index[-1]
171                ax_base.scatter(px,py,s = 800*pz/df["z"].mean(),
172                   c = cmap[len(dfdata)-1:len(dfdata)],alpha = 0.5,zorder = 4)
173                ax_base.annotate(p,xy = (px,py),  xycoords = "data",
174                        xytext = (-15,10),fontsize = 20,fontweight = "bold",
175                        color = cmap[k-1], textcoords = "offset points",zorder = 5)
176
177            if m==1:
178                px,py,pz = dfdata["x"][[-1]],dfdata["y"][[-1]],dfdata["z"][-1]
179                p = dfdata.index[-1]
180                ax_base.scatter(px,py,s = 400*pz/df["z"].mean(),
181                   c = cmap[len(dfdata)-1:len(dfdata)],alpha = 0.5,zorder = 4)
182                ax_base.annotate(p,xy = (px,py),  xycoords = "data",
183                        xytext = (-15,10),fontsize = 15,fontweight = "bold",
184                        color = cmap[k-1], textcoords = "offset points",zorder = 5)
185
186            if m==2:
187                px,py,pz = dfdata["x"][[-1]],dfdata["y"][[-1]],dfdata["z"][-1]
188                p = dfdata.index[-1]
189                ax_base.scatter(px,py,s = 100*pz/df["z"].mean(),
190                   c = cmap[len(dfdata)-1:len(dfdata)],alpha = 0.5,zorder = 4)
191                ax_base.annotate(p,xy = (px,py),  xycoords = "data",
192                        xytext = (-15,10),fontsize = 10,fontweight = "bold",
193                        color = cmap[k-1], textcoords = "offset points",zorder = 5)
194
195    my_animation = animation.FuncAnimation(fig,plot_frame,frames = range(0,3*len(df)),interval = int(duration*1000))
196
197    if filename is None:
198        try:
199            from IPython.display import HTML
200            HTML(my_animation.to_jshtml())
201            return HTML(my_animation.to_jshtml())
202        except ImportError:
203            pass
204    else:
205        my_animation.save(filename)
206        return filename
207
208
209html_file = "中国116所211高校位置分布.html"
210bubble_map_dance(df,filename = html_file)
211
212gif_file = html_file.replace(".html",".gif")
213html_to_gif(html_file,gif_file,duration=0.5)
214
收工。
-------------------********************************** End **********-------------**-----********-**********************************
往期精彩文章推荐:

欢迎各位大佬点击链接加入群聊【helloworld开发者社区】:https://jq.qq.com/?_wv=1027&k=mBlk6nzX进群交流IT技术热点。
本文转自 https://mp.weixin.qq.com/s/hEaMbA5dCmafxkV19_eA5g,如有侵权,请联系删除。