个人数据分析学习公众号:genshang
1import matplotlib.pyplot as plt
2import seaborn as sns
3sns.set_theme(style='whitegrid',palette='deep')
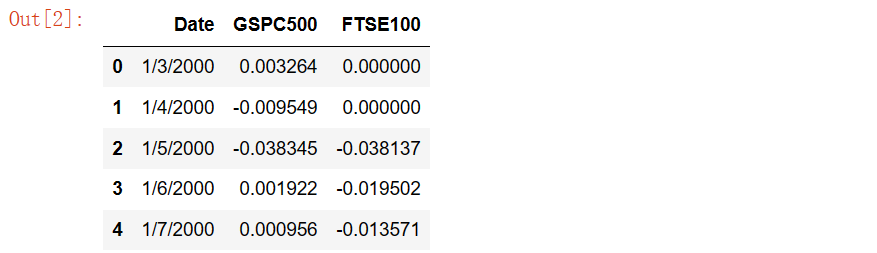
1# 读取标普500指数和富时100指数数据
2df_spx500_and_ftse100 = pd.read_csv('line_chart_data.csv')
3# 预览数据样式
4df_spx500_and_ftse100.head(5)
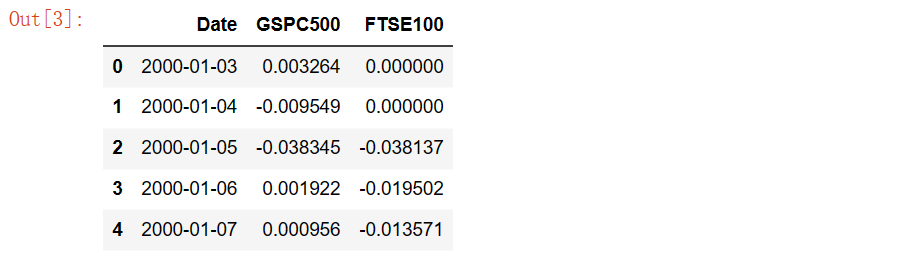
1# 此时的Date列为字符串,由于下面需要进行日期比较,所以需要将字符格式转为datetime格式
2# 数据处理:字符 >> 日期格式(通过pd.to_datetime()实现)
3df_spx500_and_ftse100['Date'] = pd.to_datetime(df_spx500_and_ftse100['Date'])
4# 预览格式转换后的结果
5df_spx500_and_ftse100.head(5)
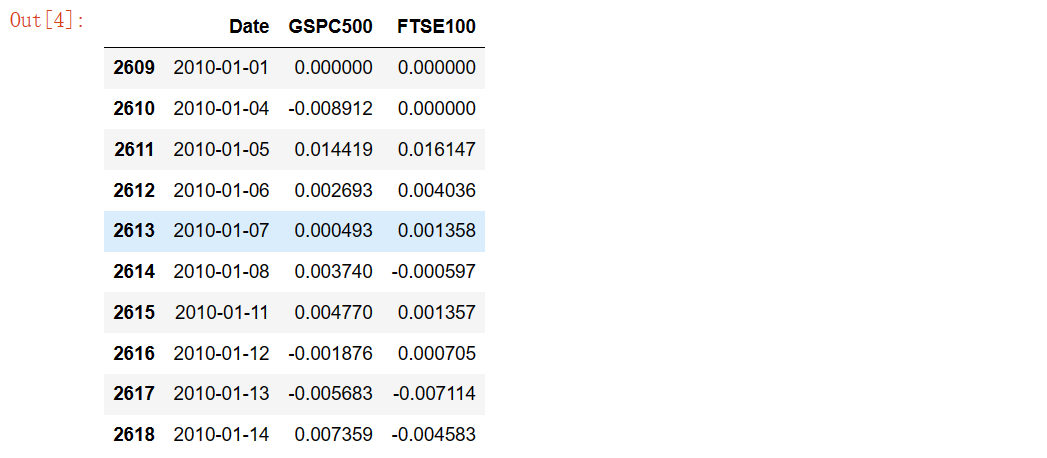
1# 设置过滤条件:只显示2010年的指数数据
2year_2010 = (df_spx500_and_ftse100['Date']>='2010-01-01') & (df_spx500_and_ftse100['Date']<='2010-12-31')
3# 生成仅包含2010年数据的新的DataFrame
4df_spx500_and_ftse100_in_2010 = df_spx500_and_ftse100[year_2010]
5# 保证日期升序没错
6df_spx500_and_ftse100_in_2010.sort_values(by='Date',inplace=True)
7# 预览效果
8df_spx500_and_ftse100_in_2010.head(10)
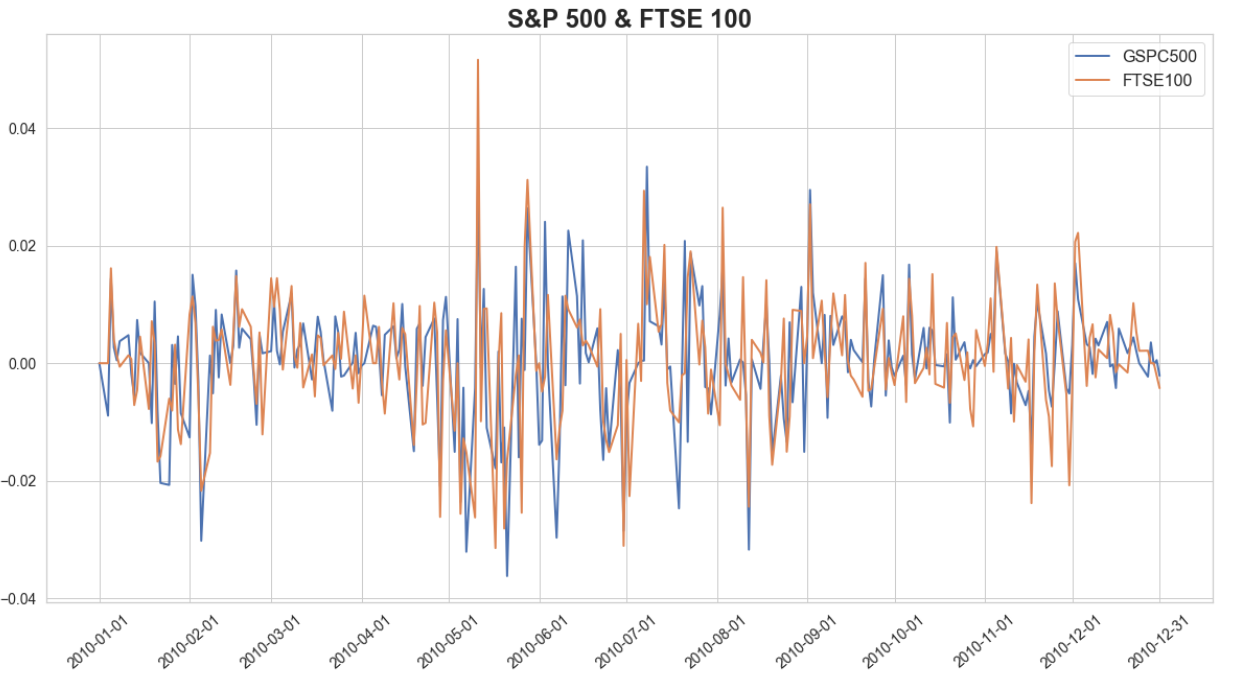
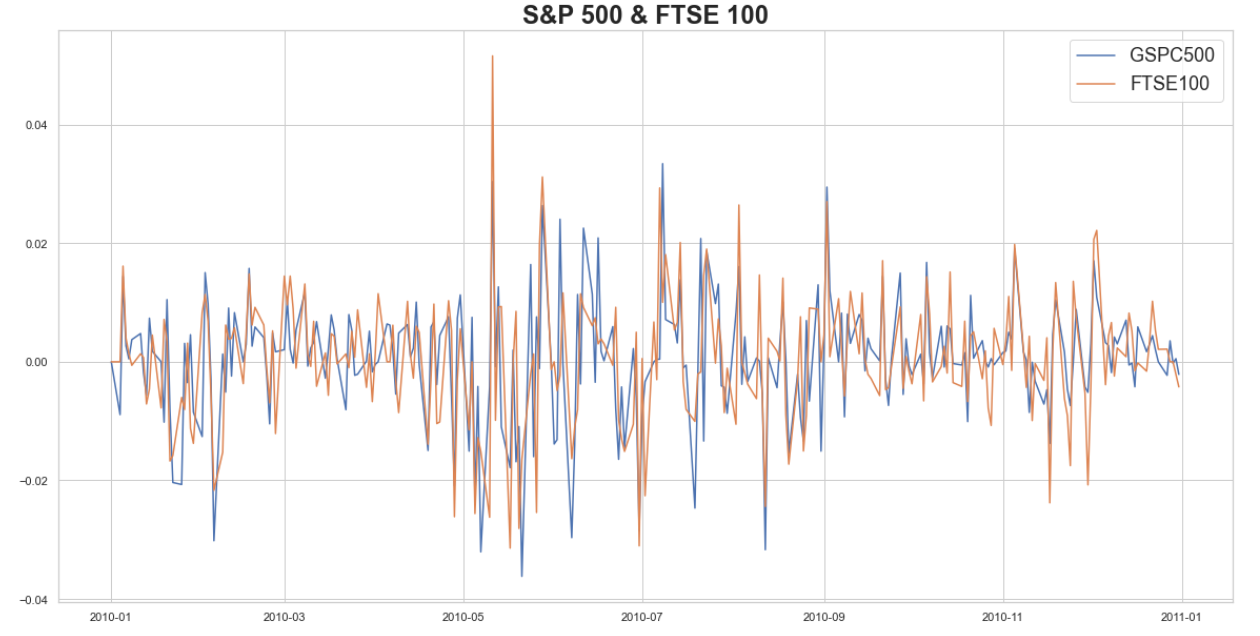
1legend_labels = ['GSPC500','FTSE100']
2plt.figure(figsize=(20,10))
3# 分别绘制两条线
4plt.plot(df_spx500_and_ftse100_in_2010['Date'],df_spx500_and_ftse100_in_2010['GSPC500'])
5plt.plot(df_spx500_and_ftse100_in_2010['Date'],df_spx500_and_ftse100_in_2010['FTSE100'])
6# 设置标题
7plt.title('S&P 500 & FTSE 100',fontsize=24, fontweight = 'bold')
8# 设置图例
9plt.legend(labels = legend_labels, loc='best', fontsize=18)
10plt.show()
1import datetime
2from dateutil.relativedelta import relativedelta
3# 生成X轴刻度:每月1号组成的list
4month_1_list = [datetime.date(2010,1,1)]
5for i in range(1,12):
6    month_1_list.append(datetime.date(2010,1,1) + relativedelta(months=+i))
7month_1_list.append(datetime.date(2010,12,31))
8# -------------------------------------------------
9legend_labels = ['GSPC500','FTSE100']
10plt.figure(figsize=(20,10))
11plt.plot(df_spx500_and_ftse100_in_2010['Date'],df_spx500_and_ftse100_in_2010['GSPC500'],linewidth=2)
12plt.plot(df_spx500_and_ftse100_in_2010['Date'],df_spx500_and_ftse100_in_2010['FTSE100'],linewidth=2)
13# 自定义X轴刻度:为每月月初(若未特殊指定,则会默认生成轴刻度)
14plt.xticks(ticks=month_1_list,rotation=40,fontsize=14)
15plt.yticks(fontsize=14)
16plt.title('S&P 500 & FTSE 100',fontsize=24, fontweight = 'bold')
17plt.legend(labels = legend_labels, loc='best', fontsize=16)
18plt.show()