
有朋友在我前两天写的一篇文章 深入浅出反射底下留言,问反射具体是怎么影响性能的?这引起了我的反思。是啊,在阐述某个观点时确实有必要说明原因,并且证明这个观点是对的,虽然反射影响性能人尽皆知,我曾经也真的研究过反射是否存在性能问题,但并没有在写文章的时候详细说明。这让我想到网上很多信息只会告诉你结论,并不会说明原因,导致很多学到的东西都是死记硬背,而不是真正掌握,别人一问或者自己亲身遇到同样的问题时,傻眼了。
反射真的存在性能问题吗?
还是使用上篇文章的 Demo,为了放大问题找到共性,采用逐渐扩大测试次数、每次测试多次取平均值的方式。针对同一个方法分别就直接调用该方法、反射调用该方法、直接调用该方法对应的实例、反射调用该方法对应的实例,分别从1-1000000,每个数量级测试一次:
测试代码如下:
1public class ReflectionPerformanceActivity extends Activity{
2    private TextView mExecuteResultTxtView = null;
3    private EditText mExecuteCountEditTxt = null;
4    private Executor mPerformanceExecutor = Executors.newSingleThreadExecutor();
5    private static final int AVERAGE_COUNT = 10;
6
7    @Override
8    protected void onCreate(Bundle savedInstanceState){
9        super.onCreate(savedInstanceState);
10        setContentView(R.layout.activity_reflection_performance_layout);
11        mExecuteResultTxtView = (TextView)findViewById(R.id.executeResultTxtId);
12        mExecuteCountEditTxt = (EditText)findViewById(R.id.executeCountEditTxtId);
13    }
14
15    public void onClick(View v){
16        switch(v.getId()){
17            case R.id.executeBtnId:{
18                execute();
19            }
20            break;
21            default:{
22
23            }
24            break;
25        }
26    }
27
28    private void execute(){
29        mExecuteResultTxtView.setText("");
30        mPerformanceExecutor.execute(new Runnable(){
31            @Override
32            public void run(){
33                long costTime = 0;
34                int executeCount = Integer.parseInt(mExecuteCountEditTxt.getText().toString());
35                long reflectMethodCostTime=0,normalMethodCostTime=0,reflectFieldCostTime=0,normalFieldCostTime=0;
36                updateResultTextView(executeCount + "毫秒耗时情况测试");
37                for(int index = 0; index < AVERAGE_COUNT; index++){
38                    updateResultTextView("第 " + (index+1) + " 次");
39                    costTime = getNormalCallCostTime(executeCount);
40                    reflectMethodCostTime += costTime;
41                    updateResultTextView("执行直接调用方法耗时:" + costTime + " 毫秒");
42                    costTime = getReflectCallMethodCostTime(executeCount);
43                    normalMethodCostTime += costTime;
44                    updateResultTextView("执行反射调用方法耗时:" + costTime + " 毫秒");
45                    costTime = getNormalFieldCostTime(executeCount);
46                    reflectFieldCostTime += costTime;
47                    updateResultTextView("执行普通调用实例耗时:" + costTime + " 毫秒");
48                    costTime = getReflectCallFieldCostTime(executeCount);
49                    normalFieldCostTime += costTime;
50                    updateResultTextView("执行反射调用实例耗时:" + costTime + " 毫秒");
51                }
52
53                updateResultTextView("执行直接调用方法平均耗时:" + reflectMethodCostTime/AVERAGE_COUNT + " 毫秒");
54                updateResultTextView("执行反射调用方法平均耗时:" + normalMethodCostTime/AVERAGE_COUNT + " 毫秒");
55                updateResultTextView("执行普通调用实例平均耗时:" + reflectFieldCostTime/AVERAGE_COUNT + " 毫秒");
56                updateResultTextView("执行反射调用实例平均耗时:" + normalFieldCostTime/AVERAGE_COUNT + " 毫秒");
57            }
58        });
59    }
60
61    private long getReflectCallMethodCostTime(int count){
62        long startTime = System.currentTimeMillis();
63        for(int index = 0 ; index < count; index++){
64            ProgramMonkey programMonkey = new ProgramMonkey("小明", "男", 12);
65            try{
66                Method setmLanguageMethod = programMonkey.getClass().getMethod("setmLanguage", String.class);
67                setmLanguageMethod.setAccessible(true);
68                setmLanguageMethod.invoke(programMonkey, "Java");
69            }catch(IllegalAccessException e){
70                e.printStackTrace();
71            }catch(InvocationTargetException e){
72                e.printStackTrace();
73            }catch(NoSuchMethodException e){
74                e.printStackTrace();
75            }
76        }
77
78        return System.currentTimeMillis()-startTime;
79    }
80
81    private long getReflectCallFieldCostTime(int count){
82        long startTime = System.currentTimeMillis();
83        for(int index = 0 ; index < count; index++){
84            ProgramMonkey programMonkey = new ProgramMonkey("小明", "男", 12);
85            try{
86                Field ageField = programMonkey.getClass().getDeclaredField("mLanguage");
87                ageField.set(programMonkey, "Java");
88            }catch(NoSuchFieldException e){
89                e.printStackTrace();
90            }catch(IllegalAccessException e){
91                e.printStackTrace();
92            }
93        }
94
95        return System.currentTimeMillis()-startTime;
96    }
97
98    private long getNormalCallCostTime(int count){
99        long startTime = System.currentTimeMillis();
100        for(int index = 0 ; index < count; index++){
101            ProgramMonkey programMonkey = new ProgramMonkey("小明", "男", 12);
102            programMonkey.setmLanguage("Java");
103        }
104
105        return System.currentTimeMillis()-startTime;
106    }
107
108    private long getNormalFieldCostTime(int count){
109        long startTime = System.currentTimeMillis();
110        for(int index = 0 ; index < count; index++){
111            ProgramMonkey programMonkey = new ProgramMonkey("小明", "男", 12);
112            programMonkey.mLanguage = "Java";
113        }
114
115        return System.currentTimeMillis()-startTime;
116    }
117
118    private void updateResultTextView(final String content){
119        ReflectionPerformanceActivity.this.runOnUiThread(new Runnable(){
120            @Override
121            public void run(){
122                mExecuteResultTxtView.append(content);
123                mExecuteResultTxtView.append("\n");
124            }
125        });
126    }
127}
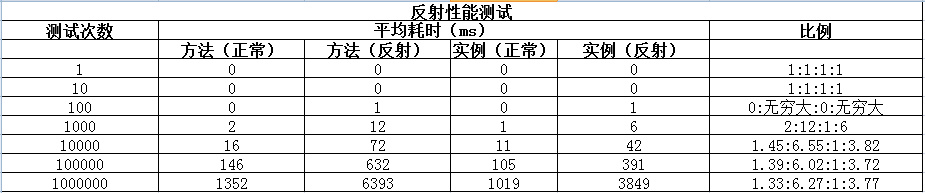
测试结果如下:
测试结论:
-
反射的确会导致性能问题;
-
反射导致的性能问题是否严重跟使用的次数有关系。如果控制在100次以内,基本上没什么差别;如果调用次数超过了100次,性能差异会很明显;
-
四种访问方式中,直接访问实例的方式效率最高;其次是直接调用方法的方式,耗时约为直接调用实例的1.4倍;接着是通过反射访问实例的方式,耗时约为直接访问实例的3.75倍;最慢的是通过反射访问方法的方式,耗时约为直接访问实例的6.2倍。
反射到底慢在哪?
跟踪源码可以发现,四个方法中都存在实例化 ProgramMonkey 的代码。所以可以排除是这句话导致的不同调用方式产生的性能差异。通过反射调用方法中调用了 setAccessible 方法,但该方法纯粹只是设置属性值,不会产生明显的性能差异。所以,最有可能产生性能差异的只有 getMethod 和 getDeclaredField、invoke和set 方法了。下面分别就这两组方法进行测试,找到具体慢在哪?
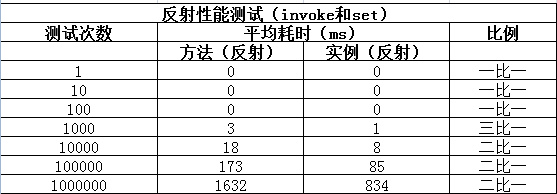
首先,测试 invoke 和 set 方法。修改 getReflectCallMethodCostTime 和 getReflectCallFieldCostTime 方法的代码如下:
1private long getReflectCallMethodCostTime(int count){
2    long startTime = System.currentTimeMillis();
3    ProgramMonkey programMonkey = new ProgramMonkey("小明", "男", 12);
4    Method setmLanguageMethod = null;
5    try{
6        setmLanguageMethod = programMonkey.getClass().getMethod("setmLanguage", String.class);
7        setmLanguageMethod.setAccessible(true);
8    }catch(NoSuchMethodException e){
9        e.printStackTrace();
10    }
11
12    for(int index = 0 ; index < count; index++){
13        try{
14            setmLanguageMethod.invoke(programMonkey, "Java");
15        }catch(IllegalAccessException e){
16            e.printStackTrace();
17        }catch(InvocationTargetException e){
18            e.printStackTrace();
19        }
20    }
21
22    return System.currentTimeMillis()-startTime;
23}
24
25private long getReflectCallFieldCostTime(int count){
26    long startTime = System.currentTimeMillis();
27    ProgramMonkey programMonkey = new ProgramMonkey("小明", "男", 12);
28    Field ageField = null;
29    try{
30        ageField = programMonkey.getClass().getDeclaredField("mLanguage");
31
32    }catch(NoSuchFieldException e){
33        e.printStackTrace();
34    }
35
36    for(int index = 0 ; index < count; index++){
37        try{
38            ageField.set(programMonkey, "Java");
39        }catch(IllegalAccessException e){
40            e.printStackTrace();
41        }
42    }
43
44    return System.currentTimeMillis()-startTime;
45}
沿用上面的测试方法,测试结果如下:
修改 getReflectCallMethodCostTime 和 getReflectCallFieldCostTime 方法对 getMethod 和 getDeclaredField 进行测试。代码如下:
1private long getReflectCallMethodCostTime(int count){
2    long startTime = System.currentTimeMillis();
3    ProgramMonkey programMonkey = new ProgramMonkey("小明", "男", 12);
4
5    for(int index = 0 ; index < count; index++){
6        try{
7            Method setmLanguageMethod = programMonkey.getClass().getMethod("setmLanguage", String.class);
8        }catch(NoSuchMethodException e){
9            e.printStackTrace();
10        }
11    }
12
13    return System.currentTimeMillis()-startTime;
14}
15
16private long getReflectCallFieldCostTime(int count){
17    long startTime = System.currentTimeMillis();
18    ProgramMonkey programMonkey = new ProgramMonkey("小明", "男", 12);
19    for(int index = 0 ; index < count; index++){
20        try{
21            Field ageField = programMonkey.getClass().getDeclaredField("mLanguage");
22        }catch(NoSuchFieldException e){
23            e.printStackTrace();
24        }
25    }
26
27    return System.currentTimeMillis()-startTime;
28}
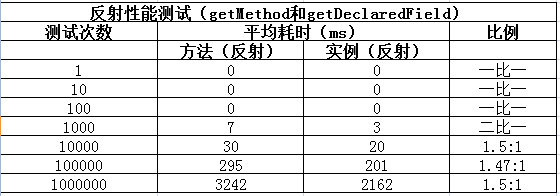
沿用上面的测试方法,测试结果如下:
测试结论:
-
getMethod 和 getDeclaredField 方法会比 invoke 和 set 方法耗时;
-
随着测试数量级越大,性能差异的比例越趋于稳定。
由于测试的这四个方法最终调用的都是 native 方法,无法进一步跟踪。个人猜测应该是和在程序运行时操作 class 有关。比如需要判断是否安全?是否允许这样操作?入参是否正确?是否能够在虚拟机中找到需要反射的类?主要是这一系列判断条件导致了反射耗时;也有可能是因为调用 natvie 方法,需要使用 JNI 接口,导致了性能问题。参照Log.java、System.out.println 都是调用 native 方法,重复调用多次耗时很明显。
如何避免反射导致的性能问题?
通过上面的测试可以看出,过度使用反射的确会存在性能问题,但如果使用得当所谓反射导致性能问题也就不是问题了。
关于反射对性能的影响,如果参照下面的使用原则并不会有什么明显的问题:
-
不要过于频繁地、大量地使用反射,这样会带来性能问题;
-
通过反射直接访问实例会比访问方法快很多,所以应该优先采用访问实例的方式。
后记
上面的测试并不全面,但在一定程度上能够反映出反射的确会导致性能问题,也能够大概知道是哪个地方导致的问题。如果后面有必要进一步测试,我会从下面几个方面作进一步测试:
-
测试频繁调用 native 方法是否会有明显的性能问题;
-
测试同一个方法内,过多的条件判断是否会有明显的性能问题;
-
测试类的复杂程度是否会对反射的性能有明显影响。