大家好,我是Python进阶者。
一、前言
前几天在Python白银交流群【Kim】问了一个Python作图的问题,问题如下:他不显示3D图咋办?
代码如下:
1from sklearn.linear_model import LogisticRegression
2import numpy as np
3from matplotlib import pyplot as plt
4from mpl_toolkits.mplot3d import Axes3D
5
6# 加载数据
7data = load_breast_cancer()
8X, y = data['data'][:,:2], data['target']
9
10# 求出两个维度对应的数据在逻辑回归算法下的最优解
11lr = LogisticRegression(fit_intercept=False)    # 是否计算截距项
12lr.fit(X, y)
13# 分别把两个维度所对应的参数w1和w2取出来
14theta1 = lr.coef_[0, 0]
15theta2 = lr.coef_[0, 1]
16print(theta1)
17print(theta2)
18
19def p_theta_function(features, w1, w2):
20    """
21    已知w1和w2的情况下,传进来数据X,返回数据的y_predict
22    :param features:xi=(x1, x2)
23    :param w1:
24    :param w2:
25    :return:  y_pred
26    """
27    # z = $\theta^Tx=w1*x1+w2*x2$
28    z = w1 * features[0] + w2 * features[1]
29    return 1 / (1 + np.exp(-z))
30
31def loss_function(sample_features, sample_labels, w1, w2):
32    """
33    传入一份已知数据,如果已知w1和w2,计算对应这份数据的loss损失
34    :param sample_features:
35    :param sample_labels:
36    :param w1:
37    :param w2:
38    :return:
39    """
40    result = 0
41    # 遍历数据集中的每一条样本,并且计算每条样本的损失,加到result身上得到整体数据集
42    for feature, label in zip(sample_features, sample_labels):
43        # 计算一条样本的y_pred
44        p_result = p_theta_function(feature, w1, w2)
45        loss_result = -1 * label * np.log(p_result) - (1 - label) * np.log(1 - p_result)
46        result += loss_result
47    return result
48
49theta1_space = np.linspace(theta1-0.6, theta1+0.6, 50)
50theta2_space = np.linspace(theta2-0.6, theta2+0.6, 50)
51result1 = np.array([loss_function(X, y, i, theta2) for i in theta1_space])
52result2 = np.array([loss_function(X, y, theta1, i) for i in theta2_space])
53
54fig1 = plt.figure(figsize=(8, 6))
55plt.subplot(221)
56plt.plot(theta1_space, result1)
57
58plt.subplot(222)
59plt.plot(theta2_space, result2)
60
61plt.subplot(223)
62theta1_grid, theta2_grid = np.meshgrid(theta1_space, theta2_space)
63loss_grid = loss_function(X, y, theta1_grid, theta2_grid)
64plt.contour(theta1_grid, theta2_grid, loss_grid)
65
66plt.subplot(224)
67plt. contour(theta1_grid, theta2_grid, loss_grid, 30)
68
69fig2 = plt.figure()
70ax = Axes3D(fig2)
71ax.plot_surface(theta1_grid, theta2_grid, loss_grid)
72
73plt.show()
74
二、实现过程
这里【莫生气】给了个思路如下:试试看windows下跑跑?
后来【瑜亮老师】给跑了出来,结果如下图所示:
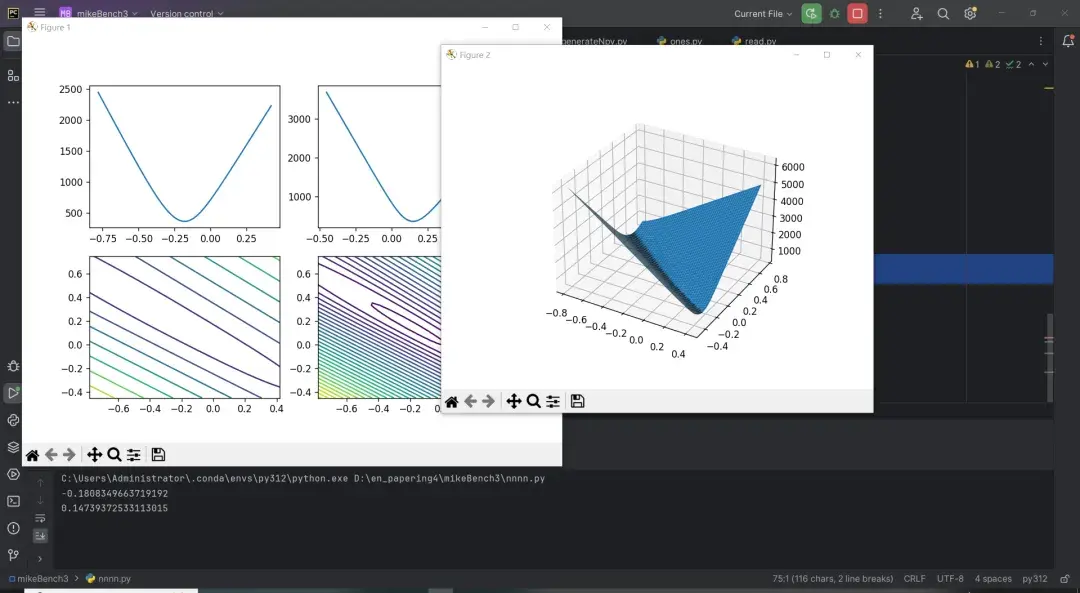
总共有两张图。粉丝反馈确实有两张图,Mac机器下,平面图没问题,3d不行。后来发现是电脑配置太低了,加载需要时间,有时候有的电脑不一定出得来结果。
【瑜亮老师】的plt是3.5的。运行后会有一个提示,只是提醒版本的变化,图是能正常出的。后来发现Axes3D(fig) 的写法在plt3.6中就不能运行了,你的是3.9版本的所以无法出图。我的是3.5因此可以,但是提示版本更改。按照楼上大佬的代码,3.5也可以正常出图,且无提示。
如果你也有类似这种Python相关的小问题,欢迎随时来交流群学习交流哦,有问必答!
三、总结
大家好,我是Python进阶者。这篇文章主要盘点了一个Python正则表达式的问题,文中针对该问题,给出了具体的解析和代码实现,帮助粉丝顺利解决了问题。
最后感谢粉丝【Kim】提出的问题,感谢【瑜亮老师】给出的思路,感谢【莫生气】等人参与学习交流。
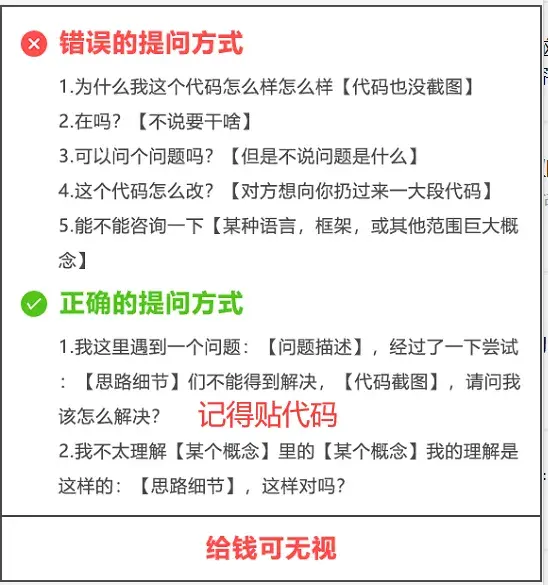
【提问补充】温馨提示,大家在群里提问的时候。可以注意下面几点:如果涉及到大文件数据,可以数据脱敏后,发点demo数据来(小文件的意思),然后贴点代码(可以复制的那种),记得发报错截图(截全)。代码不多的话,直接发代码文字即可,代码超过50行这样的话,发个.py文件就行。