简介
Alertmanager 主要用于接收 Prometheus 发送的告警信息,它很容易做到告警信息的去重,降噪,分组,策略路由,是一款前卫的告警通知系统。它支持丰富的告警通知渠道,可以将告警信息转发到邮箱、企业微信、钉钉等。这一节讲解利用AlertManager,把接受到的告警信息,转发到邮箱。
实验
准备
启动 http-simulator 度量模拟器:
docker run --name http-simulator -d -p 8080:8080 pierrevincent/prom-http-simulator:0.1
启动 Prometheus,为了方便更新配置,使用挂载配置文件的方式:
1docker run --name prometheus -d -p 9090:9090 -v /Users/huanchu/Documents/prometheus-data:/prometheus-data \
2       prom/prometheus --web.enable-lifecycle --config.file=/prometheus-data/prometheus.yml
启动添加了参数 --web.enable-lifecycle,让Prometheus支持通过web端点动态更新配置。
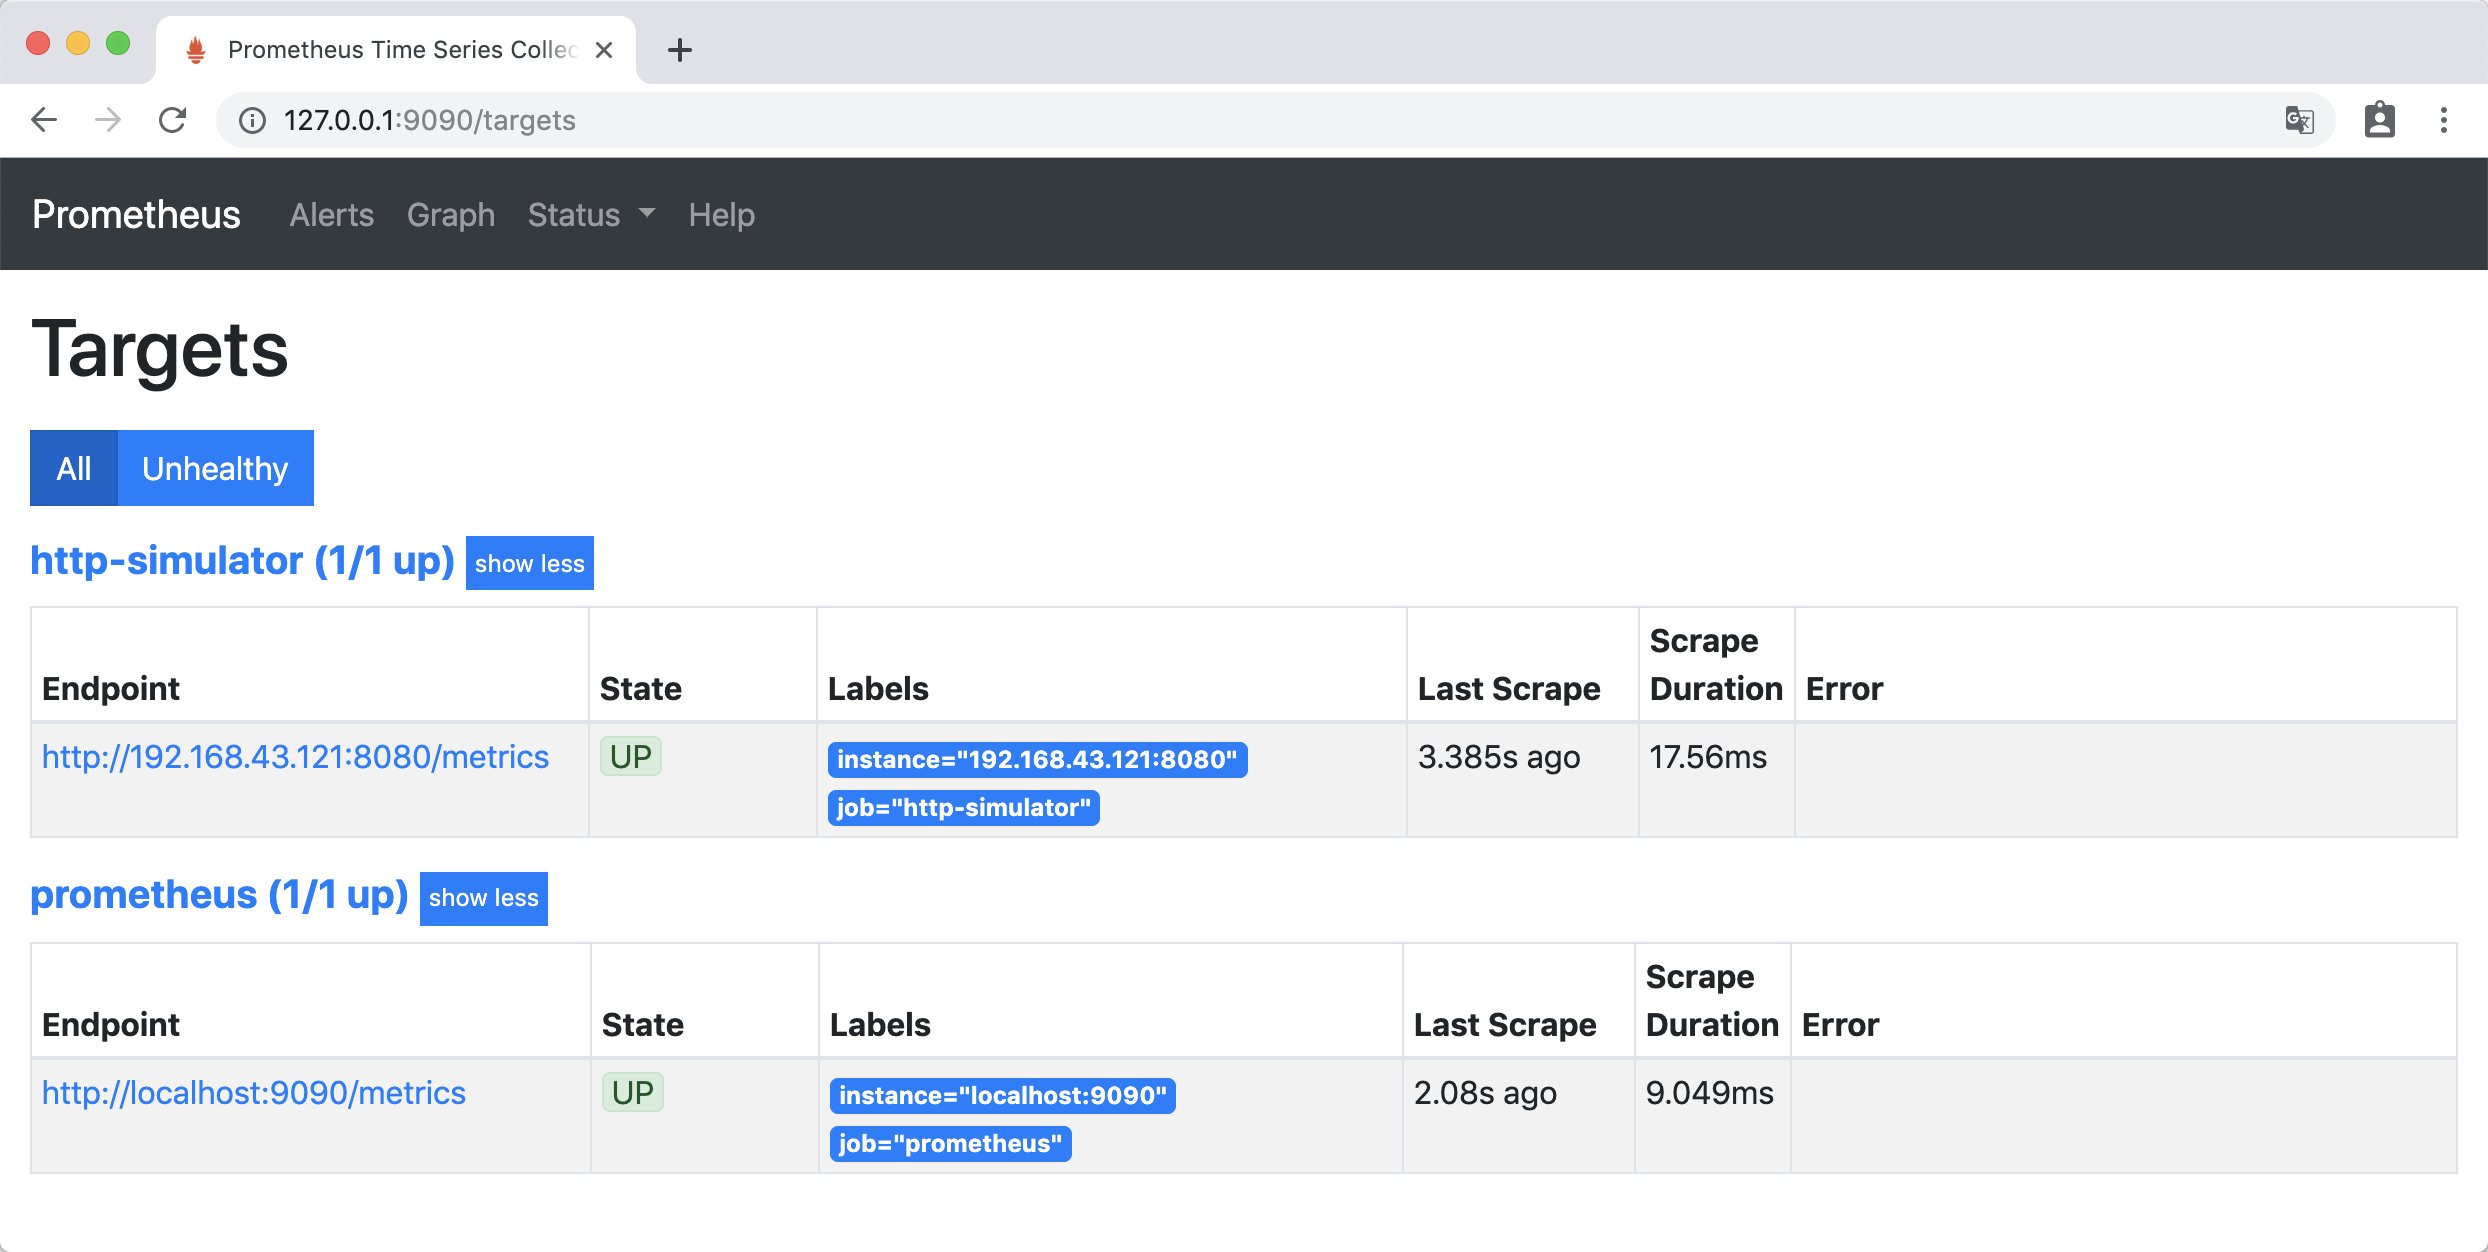
访问http://127.0.0.1:9090/targets ,Prometheus 自身的 metrics 和 http-simulator 的 metrics 处于up 状态 ,那么准备工作就做好了。
实验
实验1
告警配置
在prometheus-data文件夹下,创建告警配置文件 simulator_alert_rules.yml:
1groups:
2- name: simulator-alert-rule
3  rules:
4  - alert: HttpSimulatorDown
5    expr: sum(up{job="http-simulator"}) == 0
6    for: 1m
7    labels:
8      severity: critical
配置文件的意思是 http-simulator 服务up状态为 0 ,并且持续1分钟时,产生告警 ,级别为 “严重的”。
修改prometheus.yml,引用simulator_alert_rules.yml文件,prometheus.yml 内容如下:
1global:
2  scrape_interval: 5s
3  evaluation_interval: 5s
4  scrape_timeout: 5s
5
6rule_files:
7  - "simulator_alert_rules.yml"
8
9scrape_configs:
10  - job_name: 'prometheus'
11    static_configs:
12    - targets: ['localhost:9090']
13  - job_name: 'http-simulator'
14    metrics_path: /metrics
15    static_configs:
16    - targets: ['192.168.43.121:8080']
更新Prometheus配置:
curl -X POST http://localhost:9090/-/reload
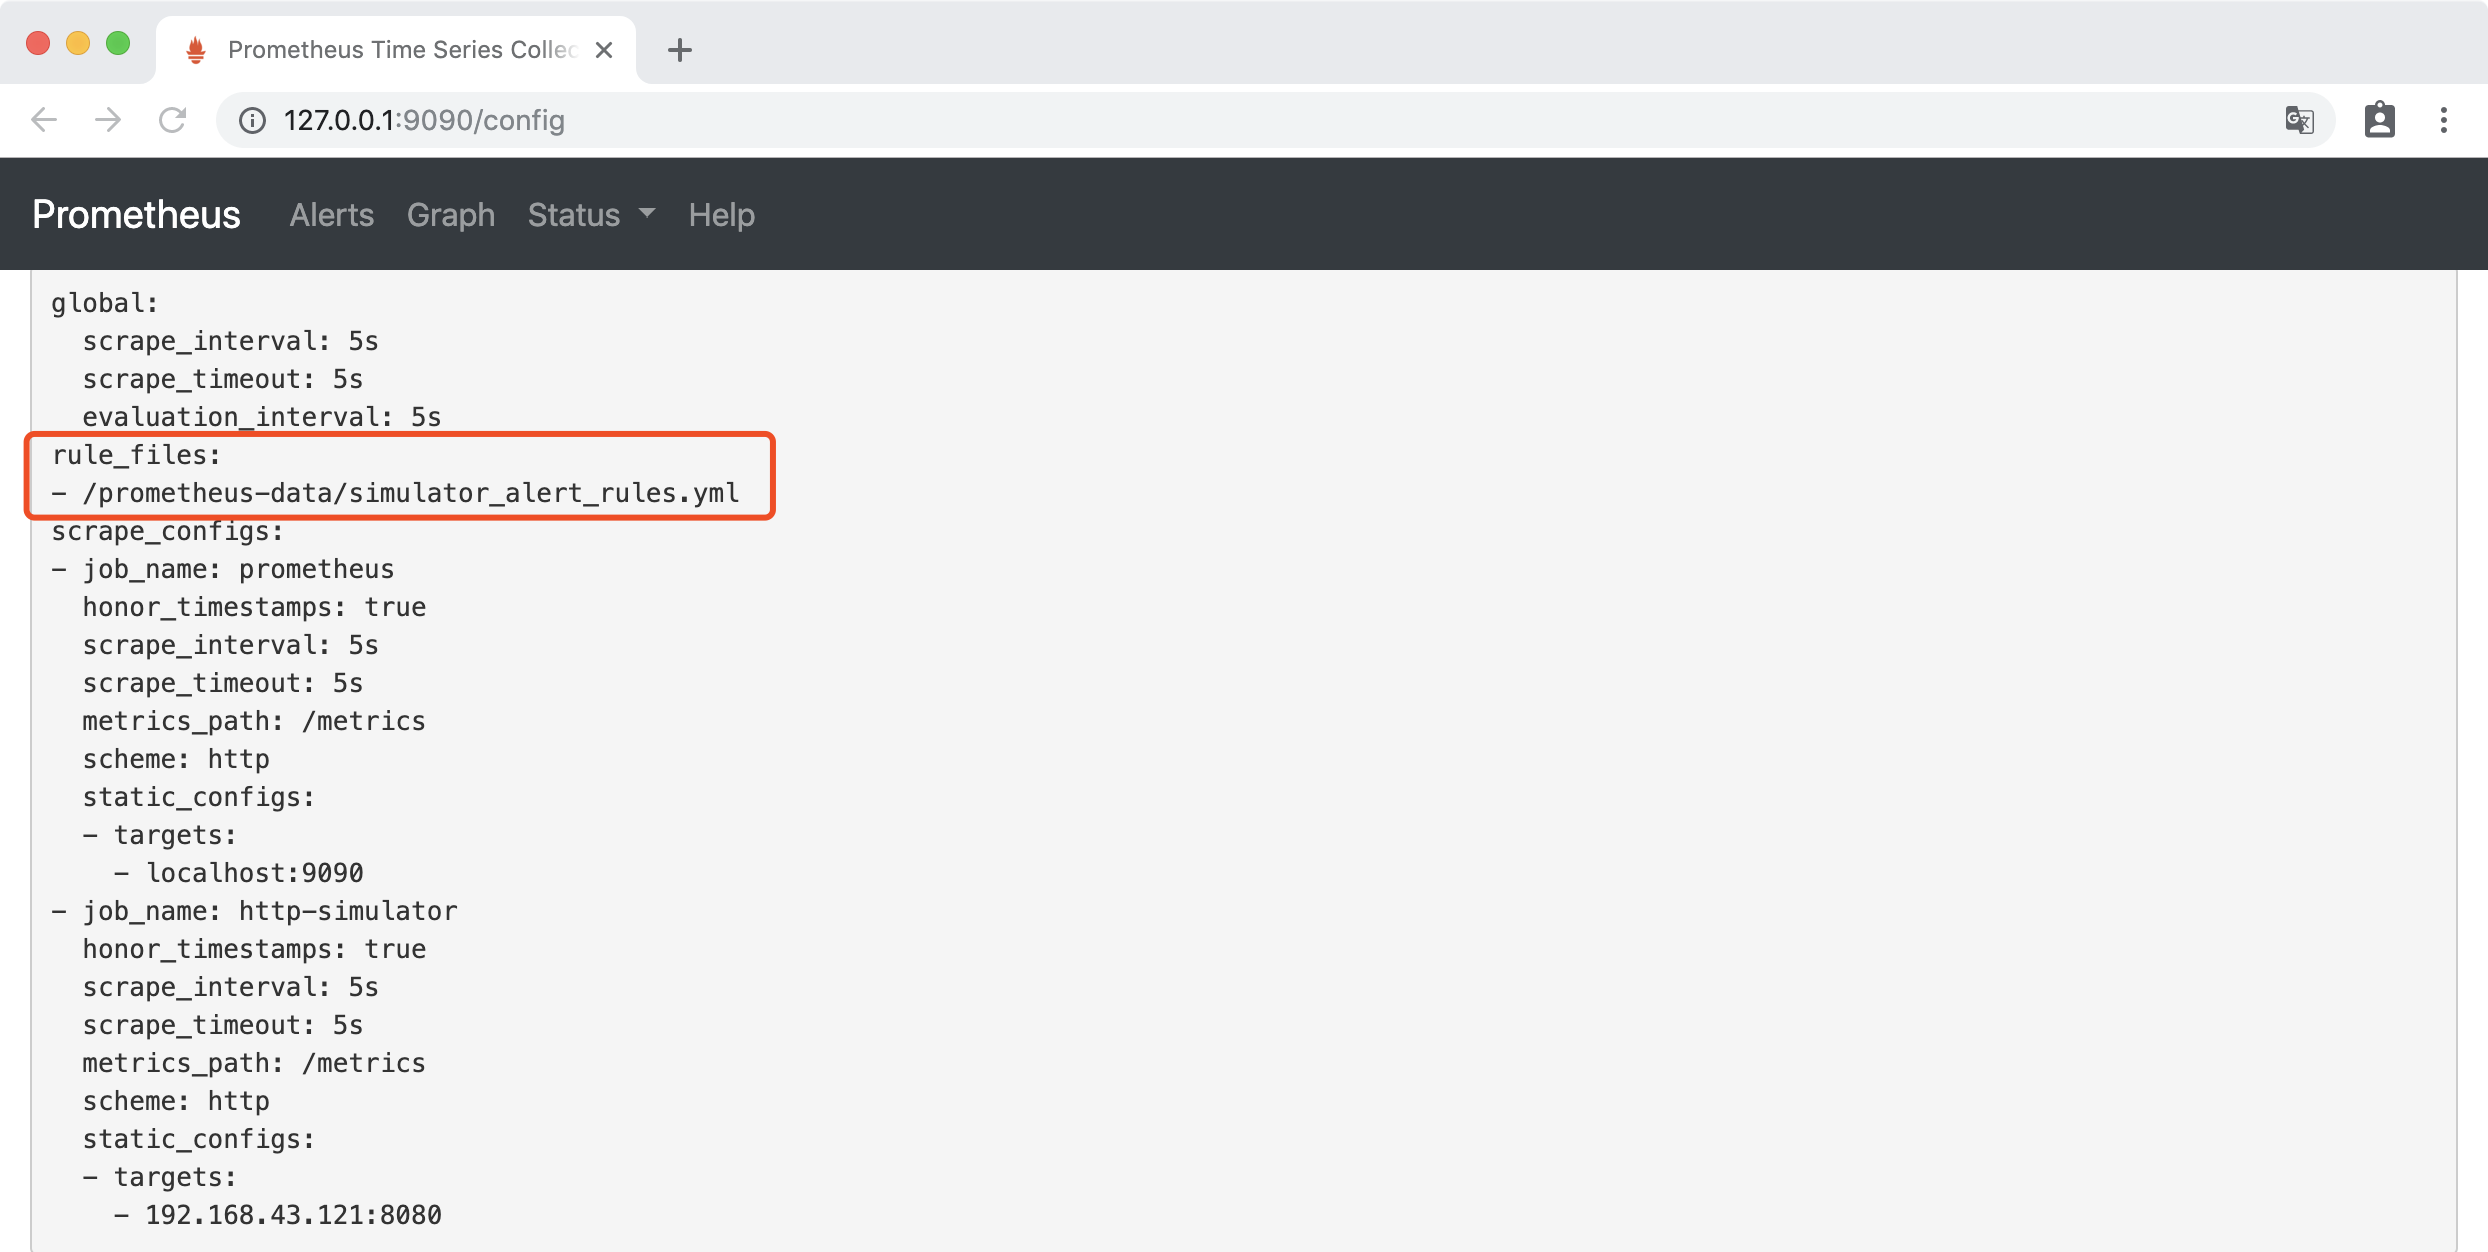
访问http://127.0.0.1:9090/config,可以看到已经为更新了配置:
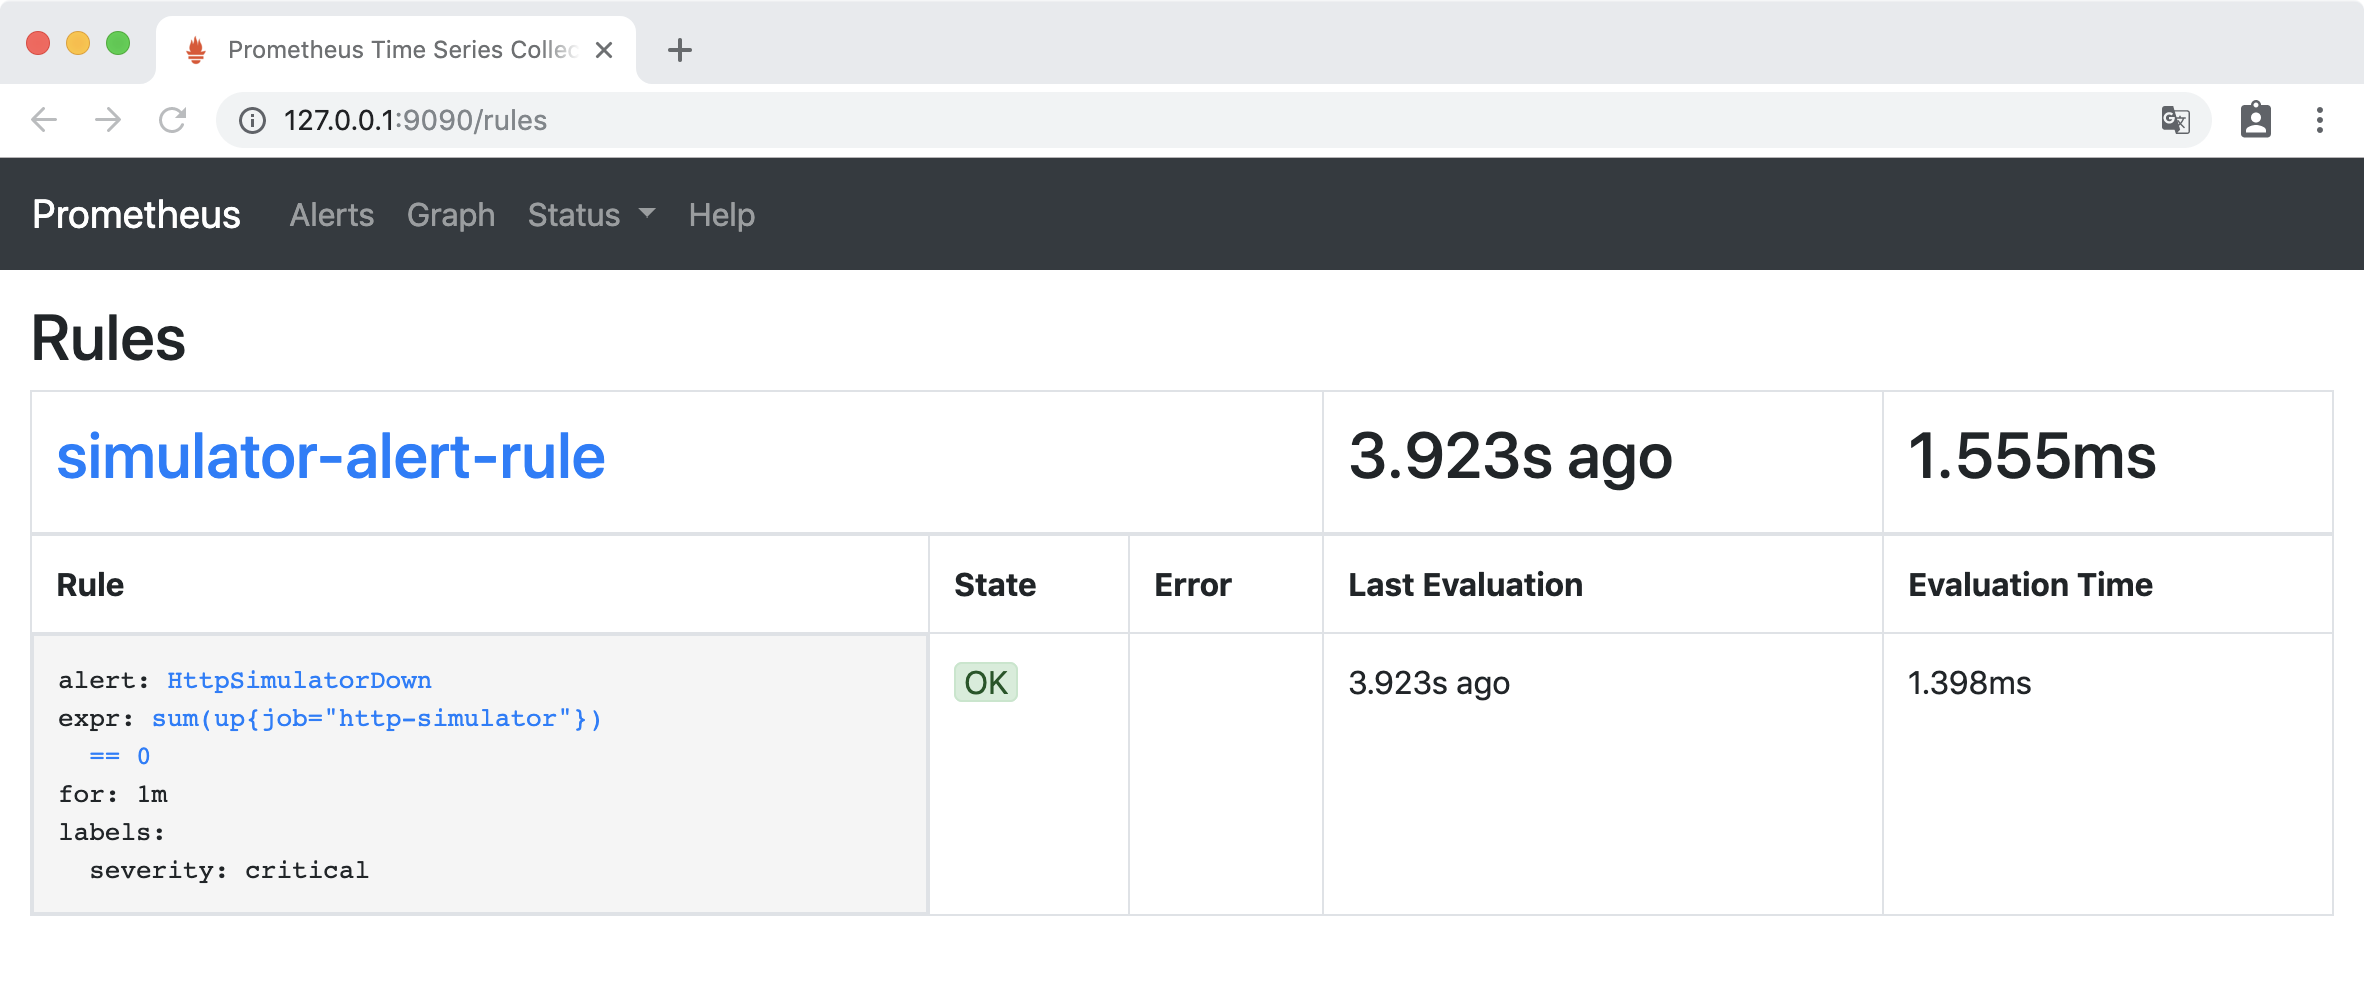
访问http://127.0.0.1:9090/rules,Rules 下出现了新添加的告警规则:
验证
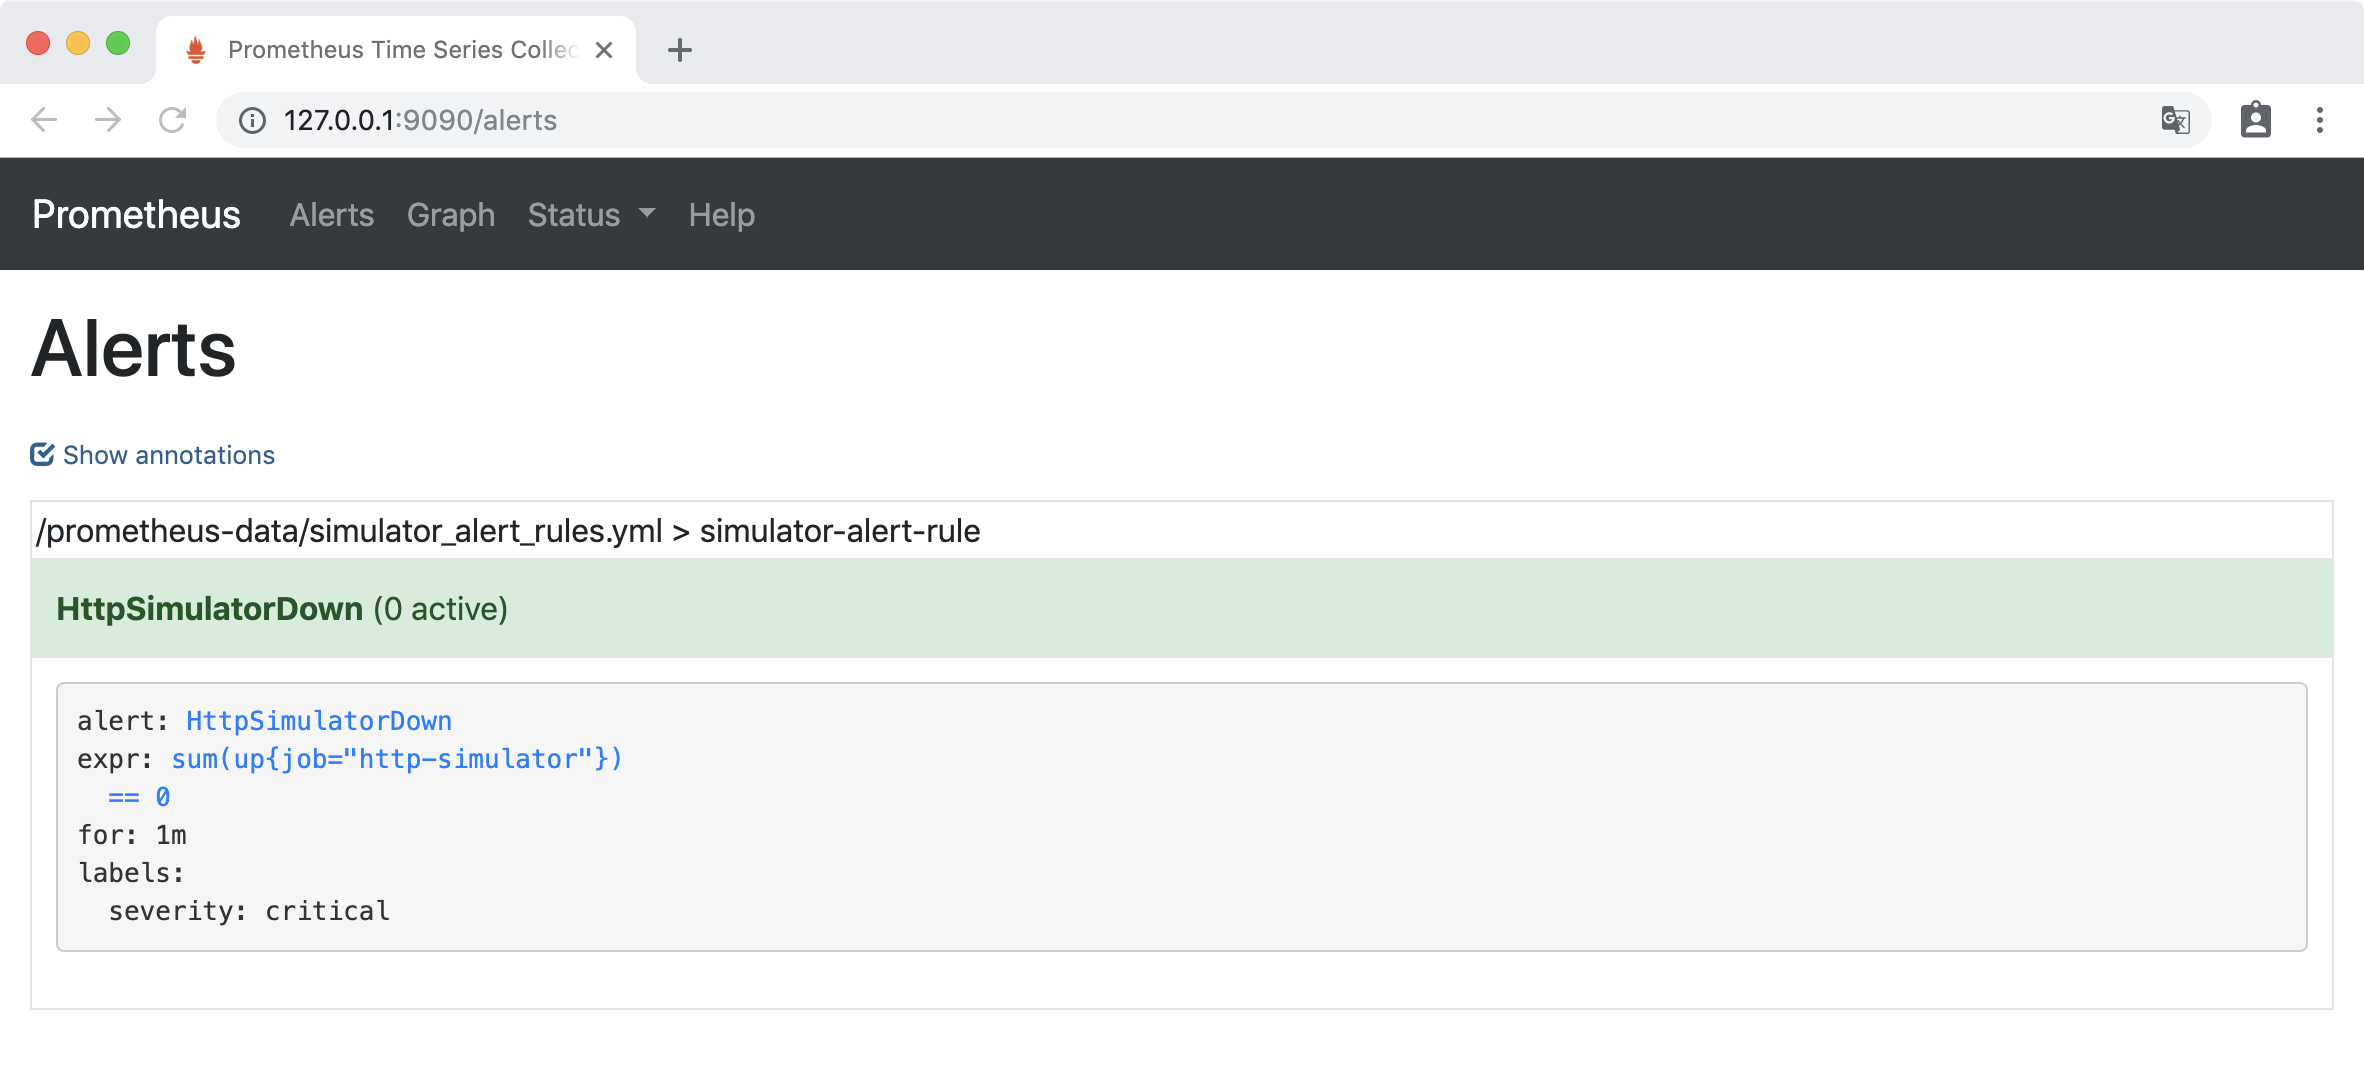
访问http://127.0.0.1:9090/alerts ,Alerts 下 HttpSimulatorDown 为绿色,处于INACTIVE 状态,表示什么都没有发生。
关闭 http-simulator 服务:
docker stop http-simulator
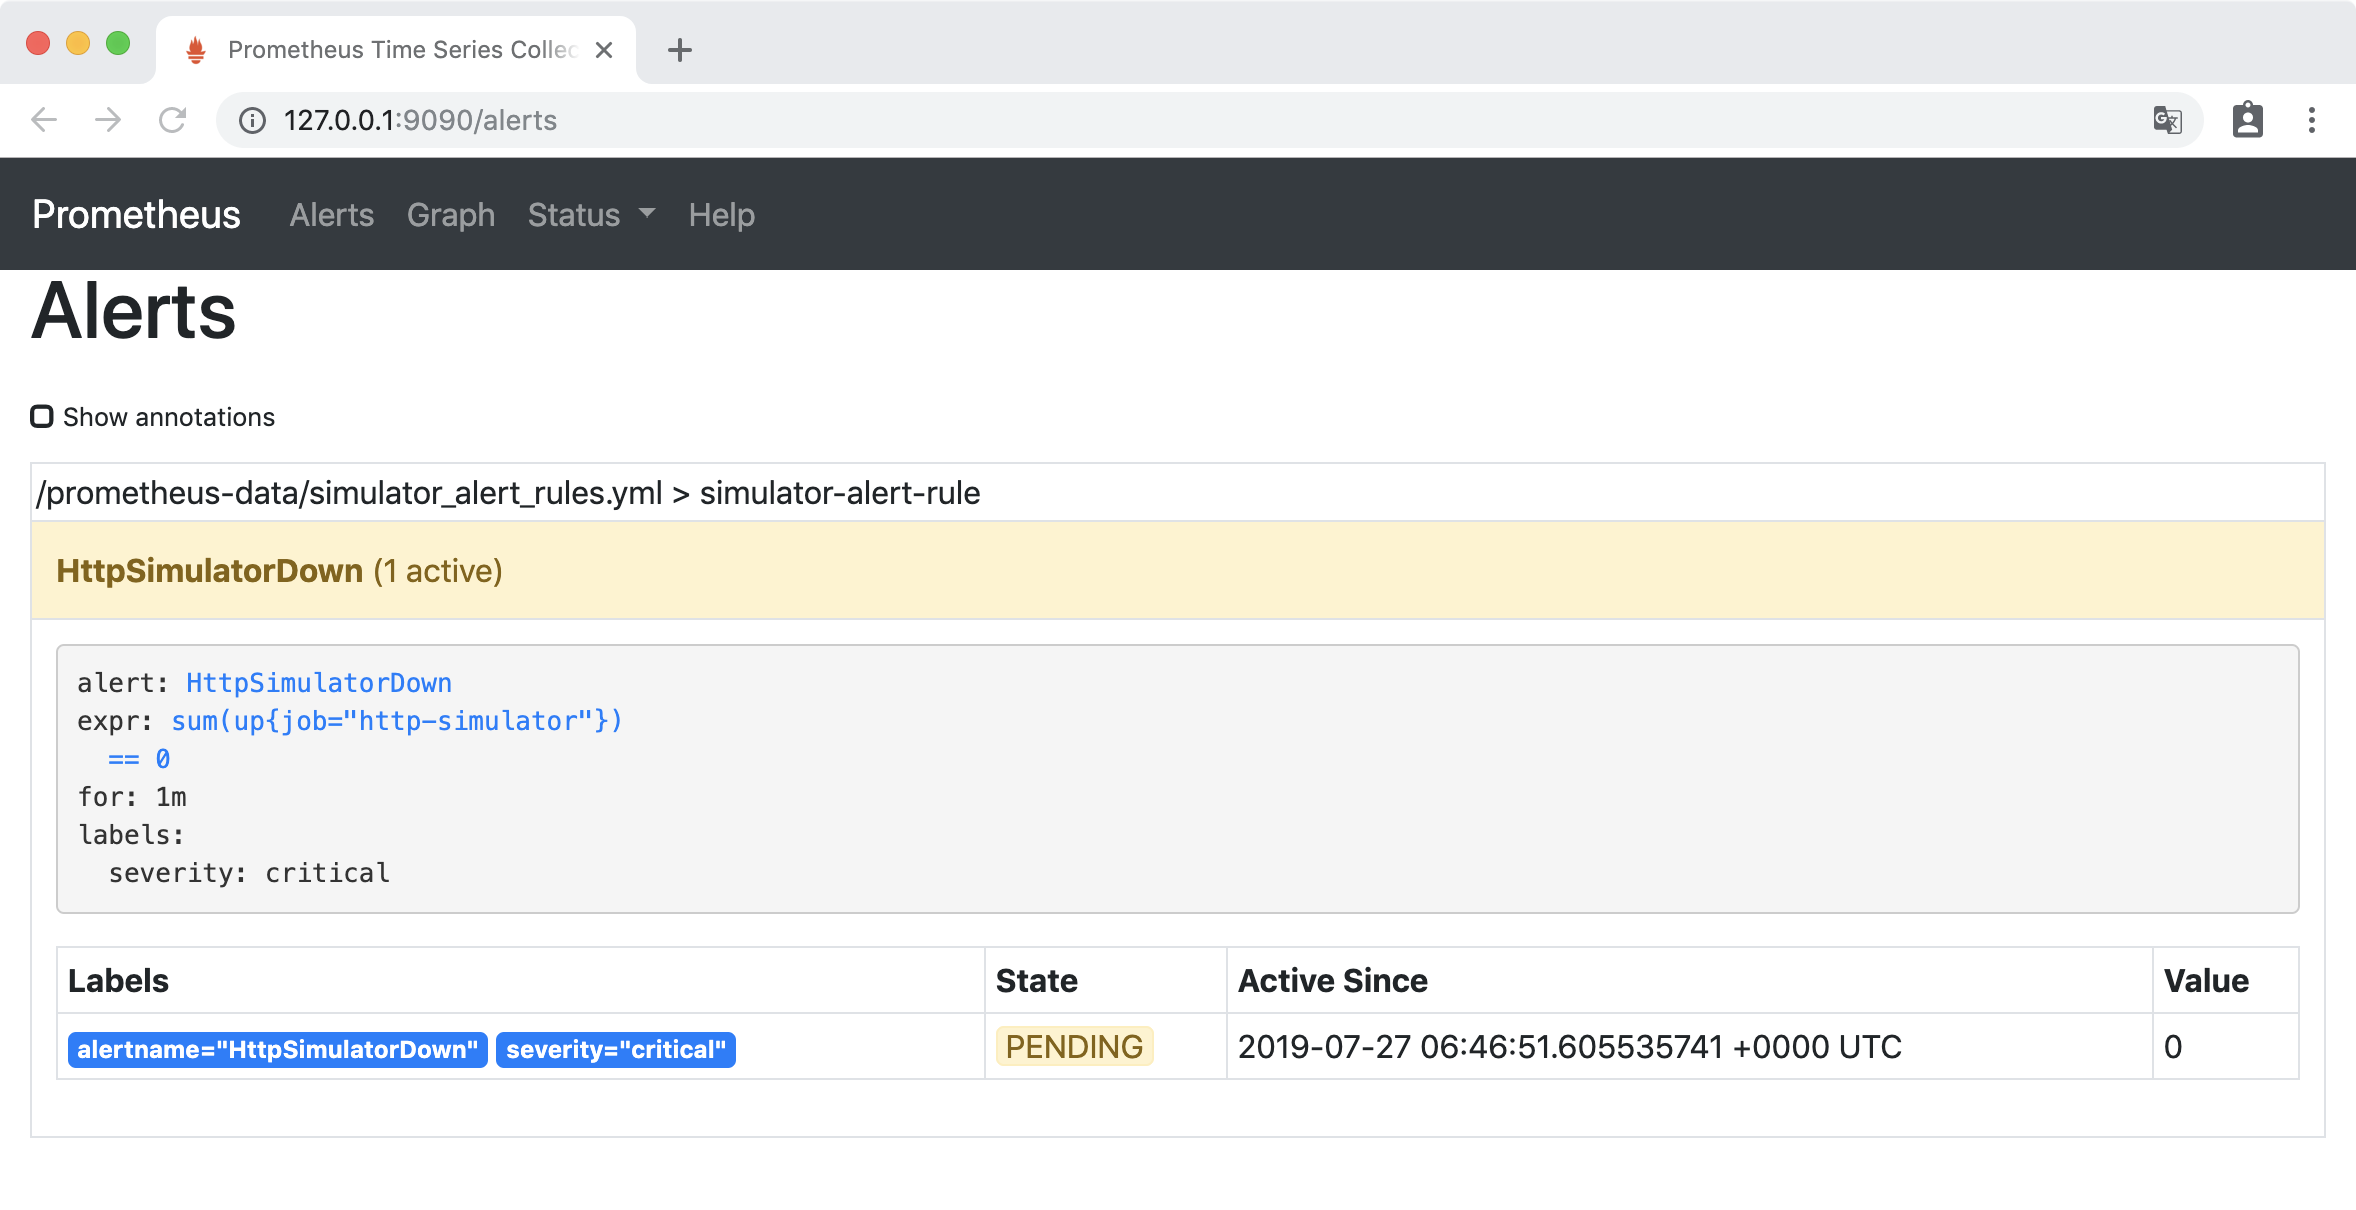
访问http://127.0.0.1:9090/alerts,HttpSimulatorDown 变成黄色,处于 PENDING 状态,表示报警即将被激活。
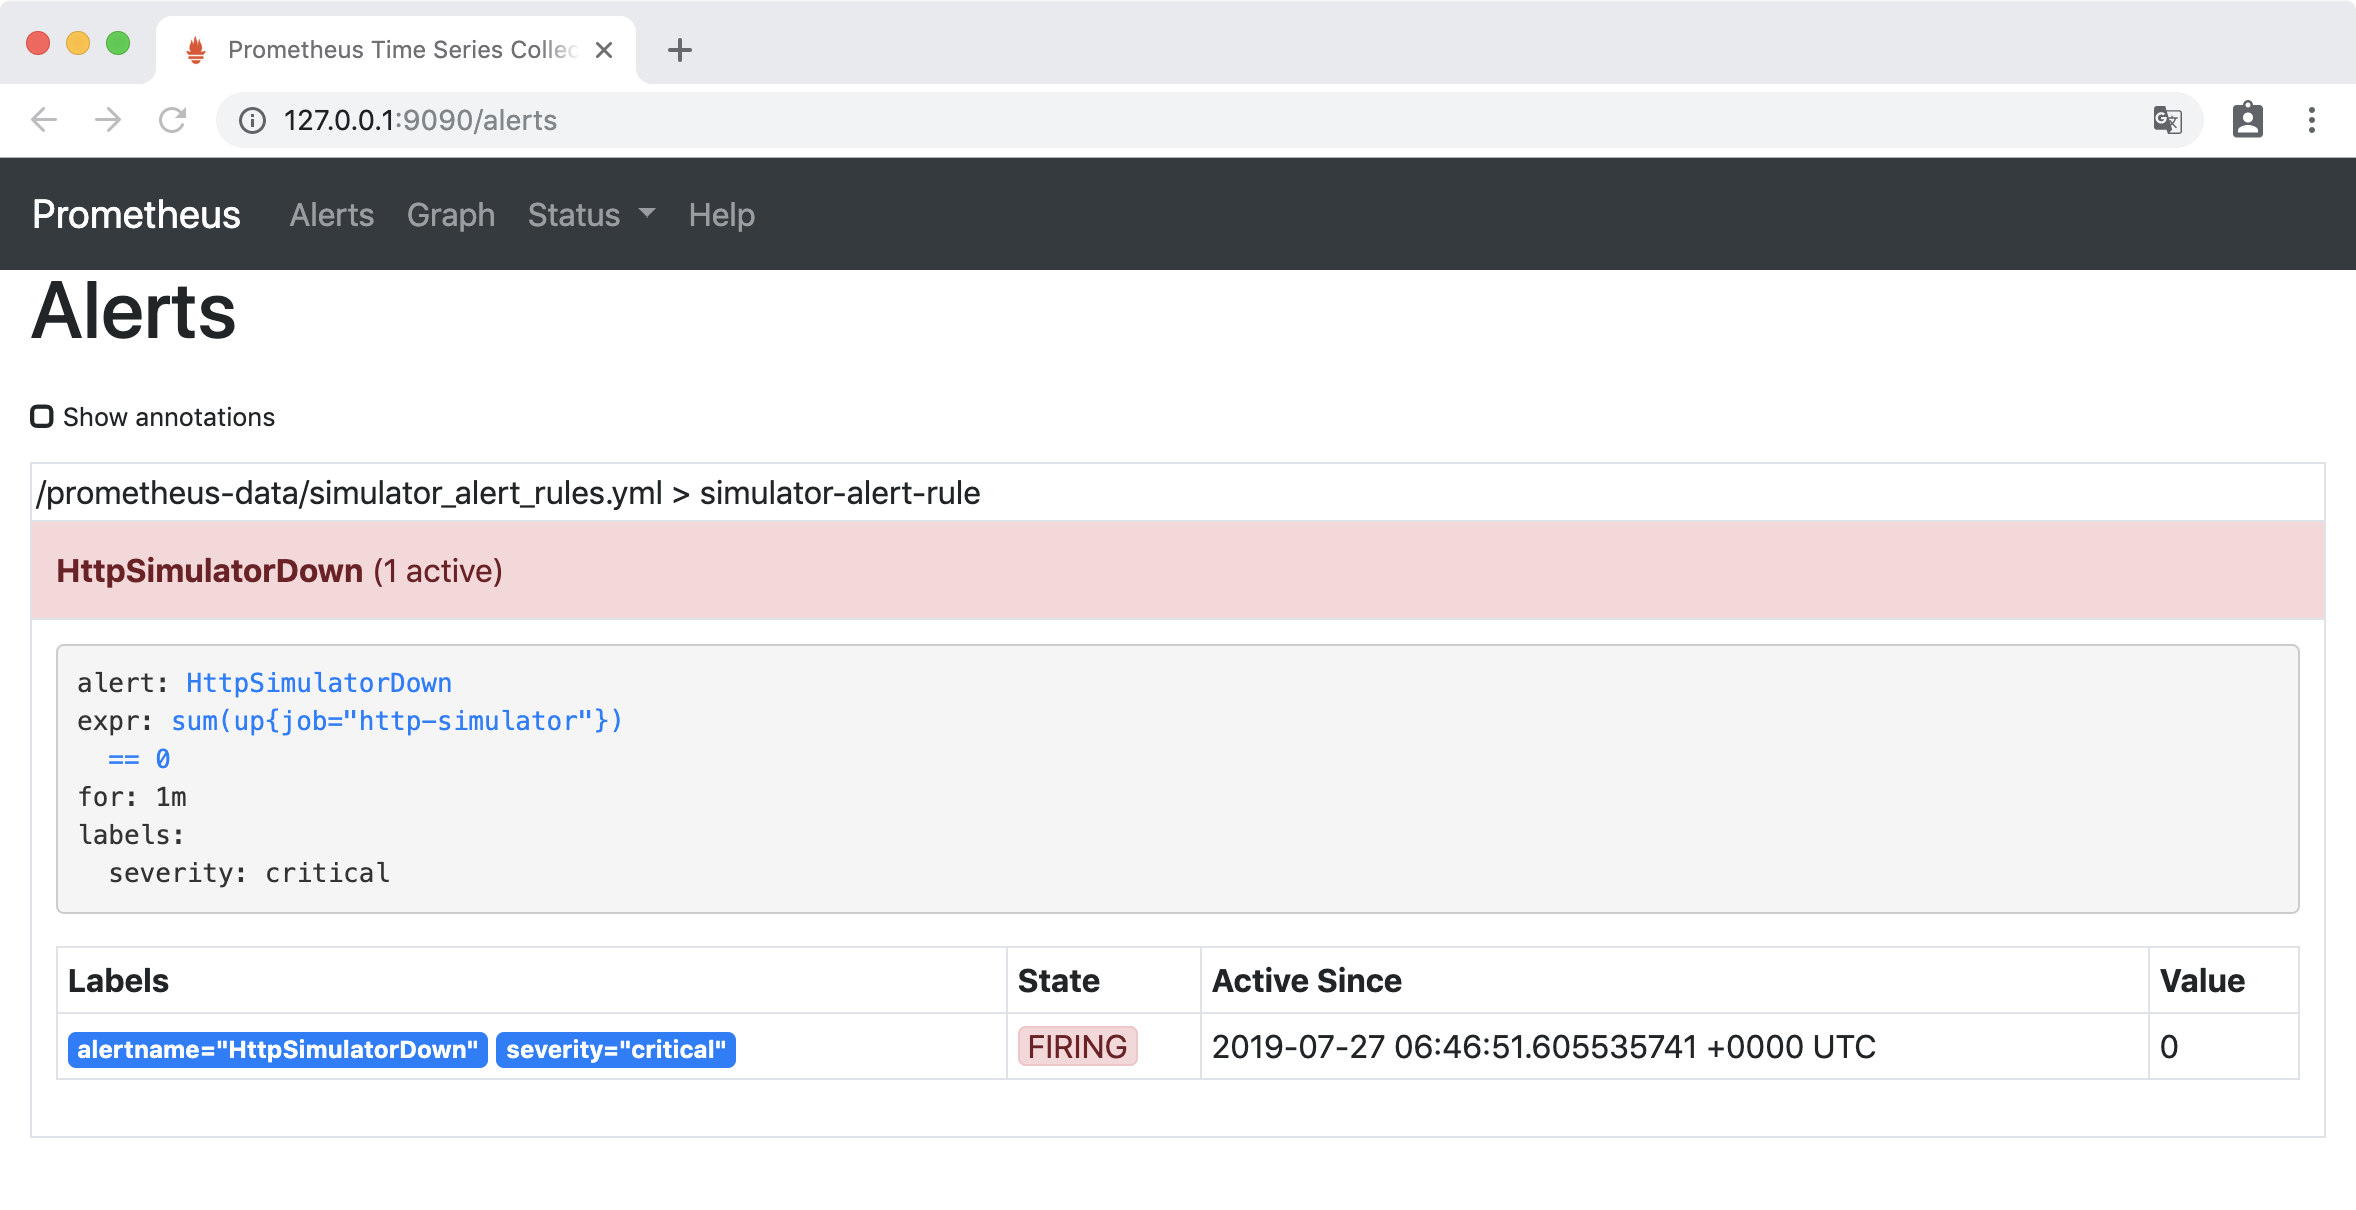
一分钟后,HttpSimulatorDown 变成红色,处于 FIRING 状态,表示报警已经被激活了。
实验2
告警配置
在simulator_alert_rules.yml文件中增加告警配置:
1- alert: ErrorRateHigh
2    expr: sum(rate(http_requests_total{job="http-simulator", status="500"}[5m])) / sum(rate(http_requests_total{job="http-simulator"}[5m])) > 0.02
3    for: 1m
4    labels:
5      severity: major
6    annotations:
7      summary: "High Error Rate detected"
8      description: "Error Rate is above 2% (current value is: {{ $value }}"
配置文件的意思是 http-simulator 请求的错误率对2% ,并且持续1分钟时,产生告警 ,级别为 “非常严重的”
更新Prometheus配置:
curl -X POST http://localhost:9090/-/reload
验证
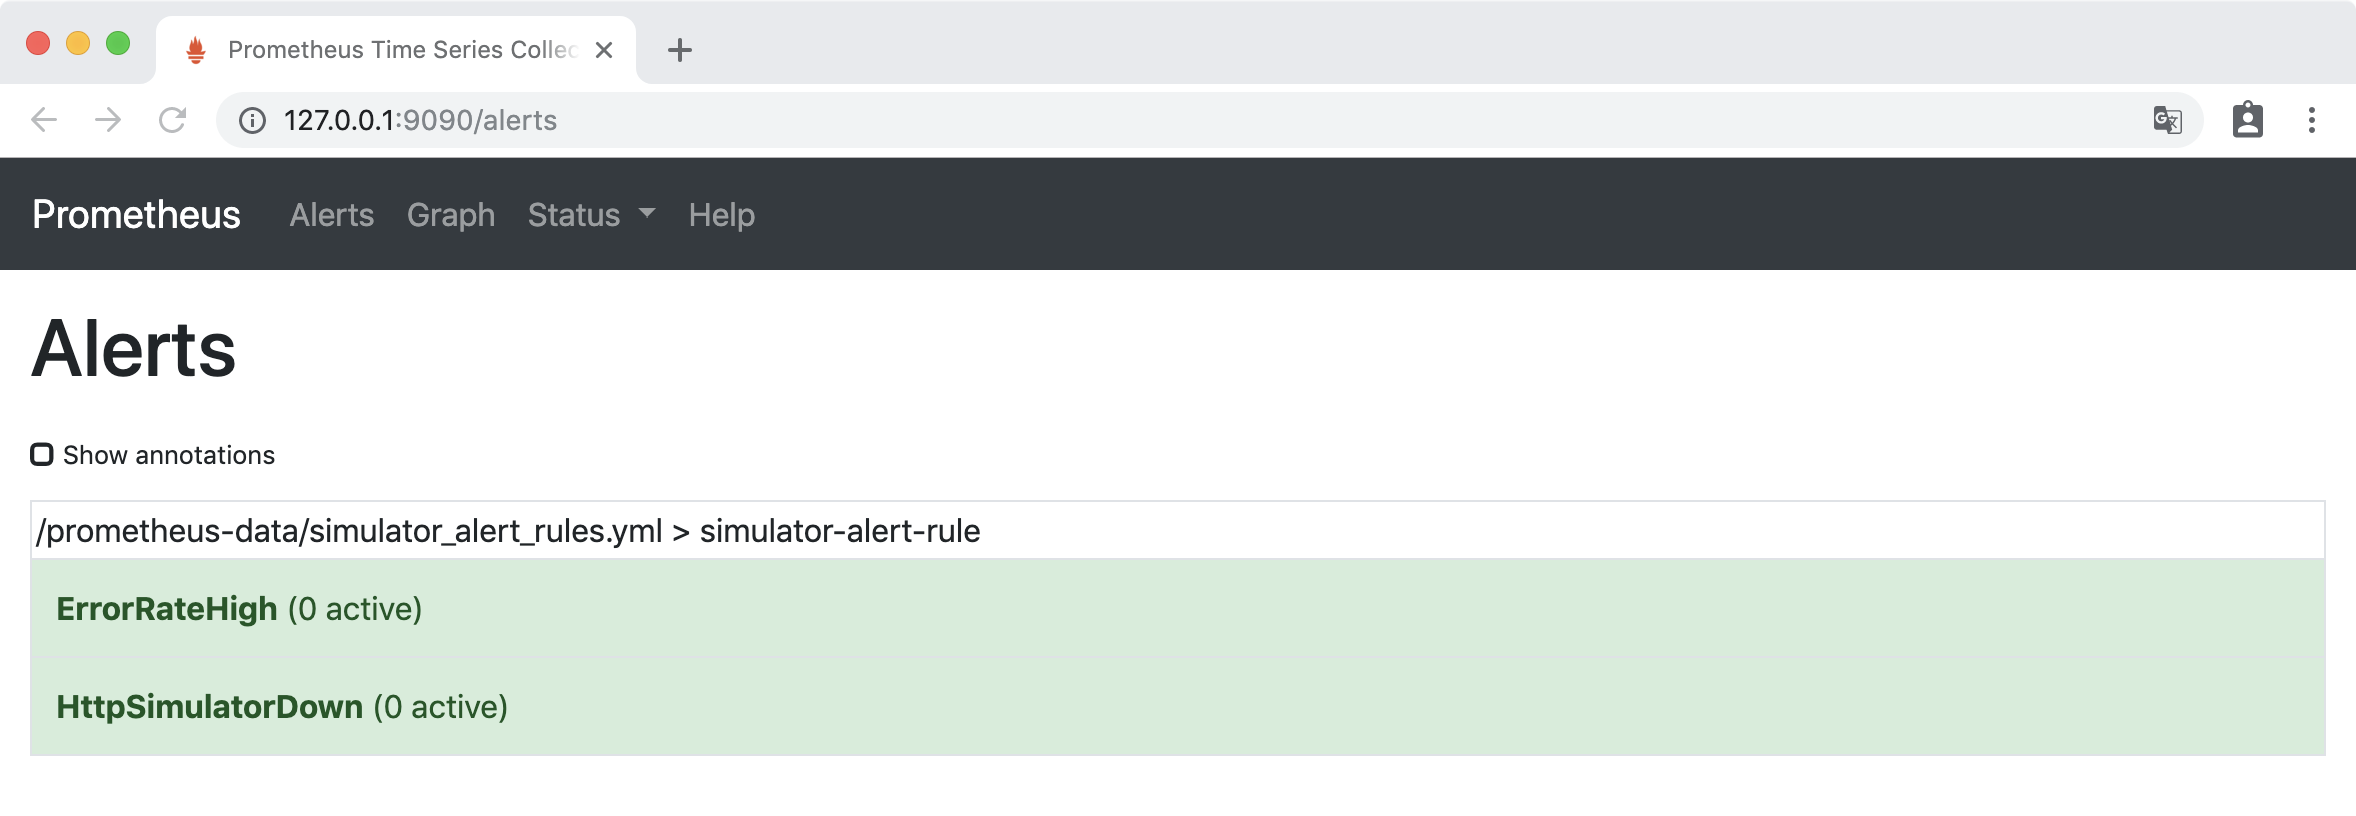
访问http://127.0.0.1:9090/alerts,ErrorRateHigh 为绿色的 INACTIVE 状态。
把 http-simulator 的错误率调到 10%
curl -H 'Content-Type: application/json' -X PUT -d '{"error_rate": 10}' http://localhost:8080/error_rate
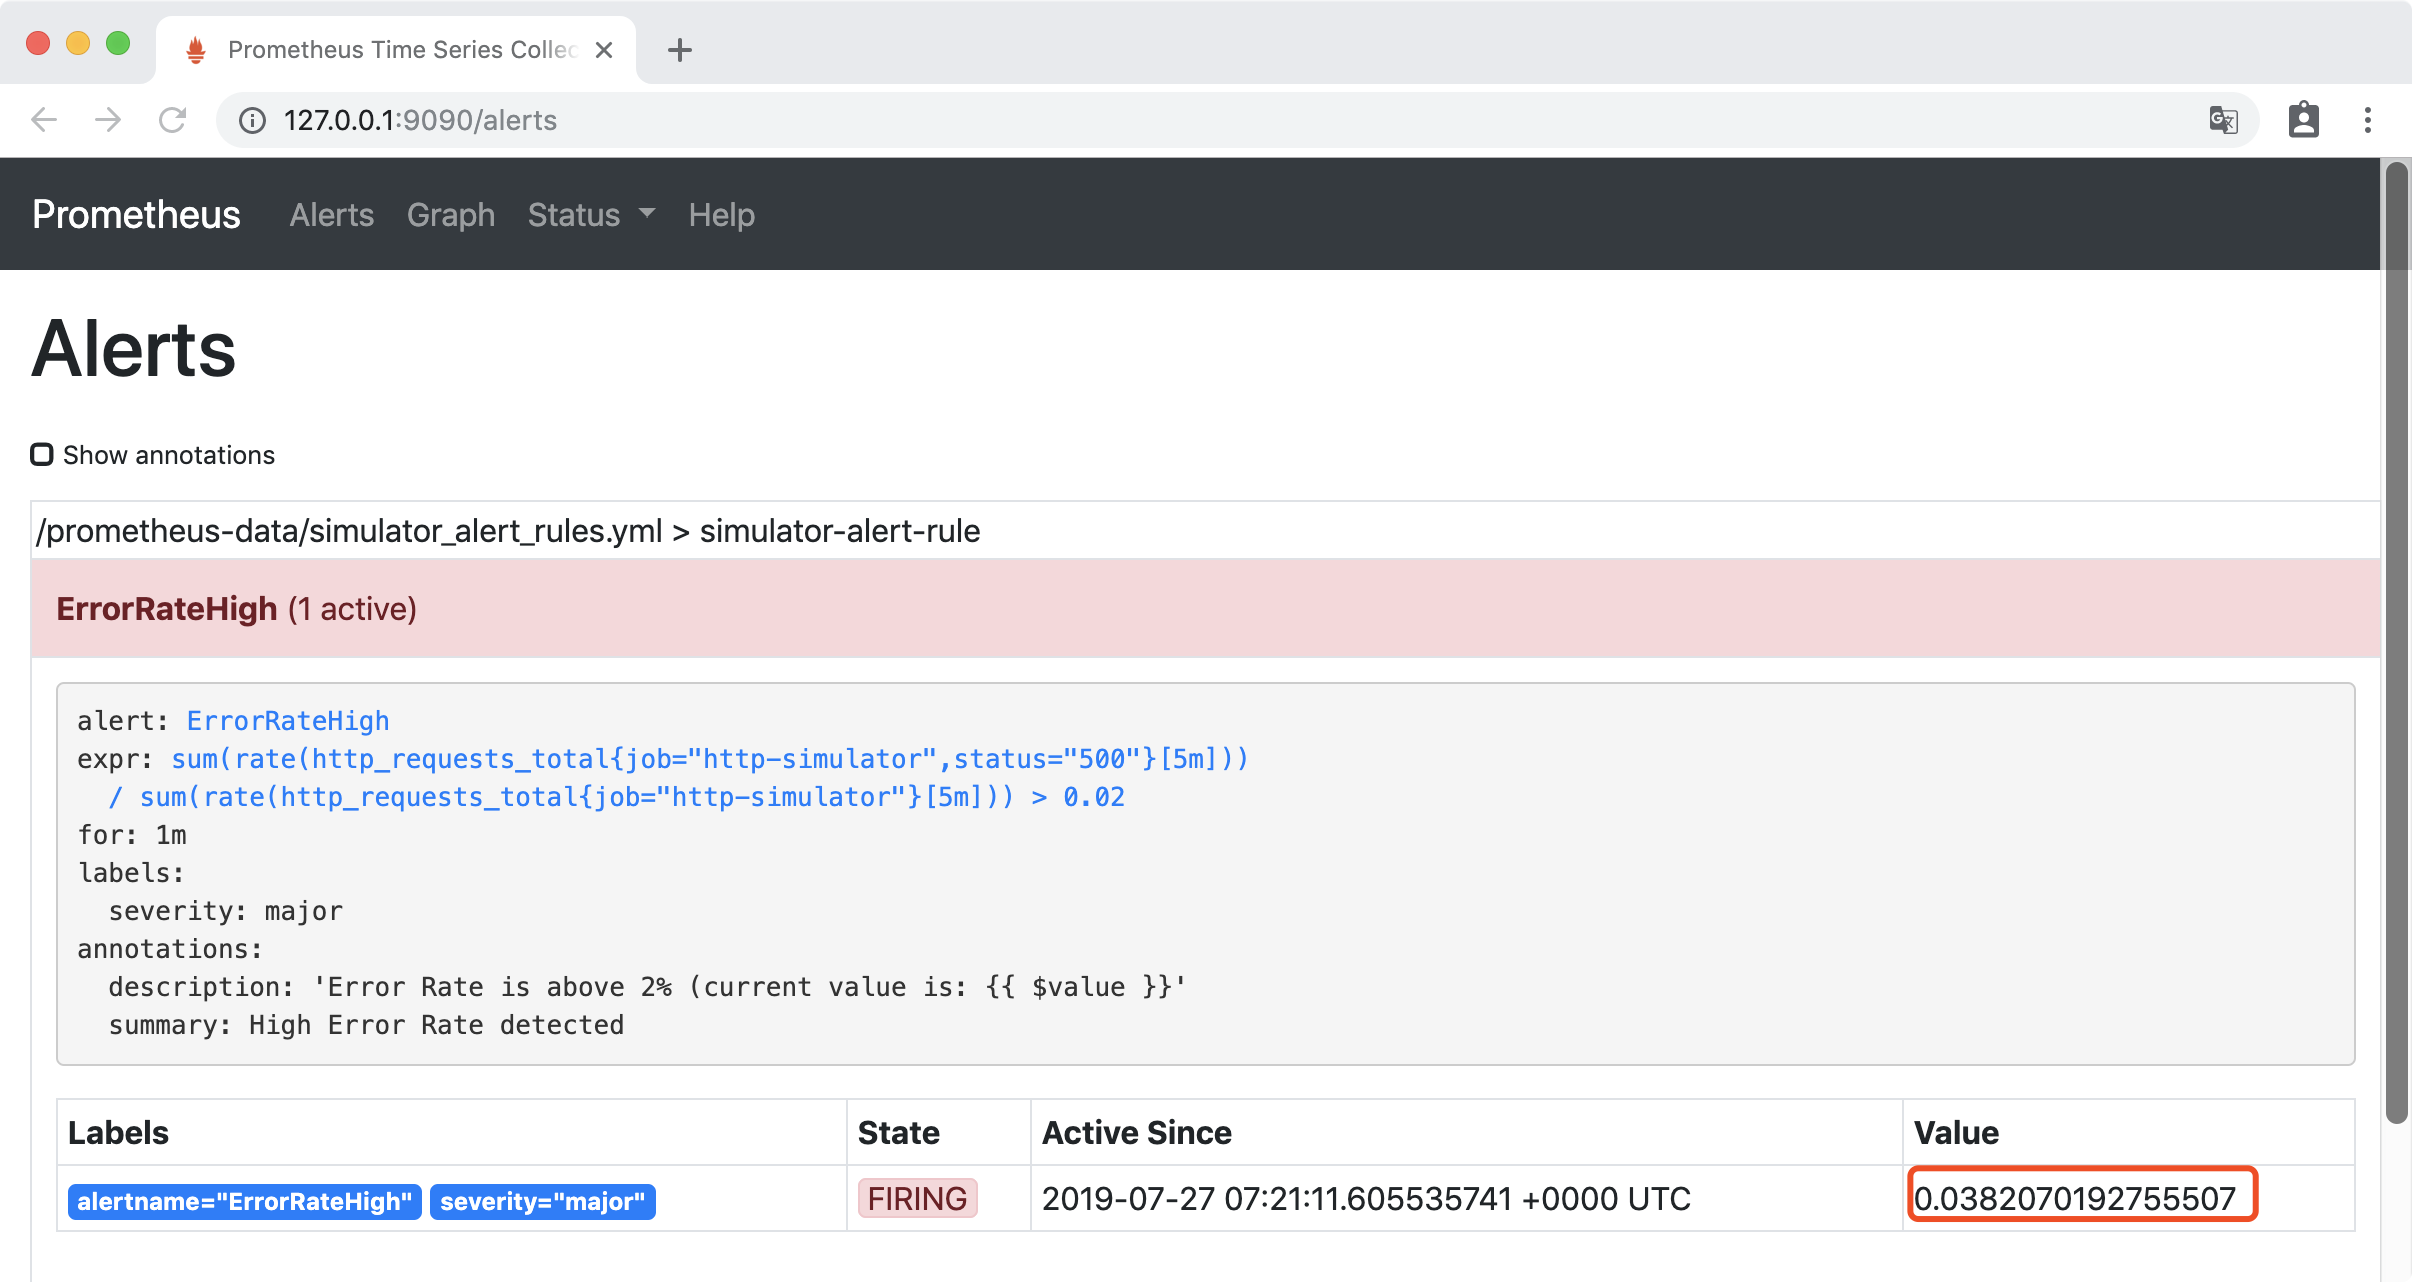
稍等一会后,访问http://127.0.0.1:9090/alerts, 可以看到错误率已经大2%,ErrorRateHigh 为红色的 FIRING 状态,报警已经被激活了。
安装和配置AlertManager
通过docker 挂载文件的方式安装AlertManager,在本地创建文件夹 alertmanager-data 文件夹,在其中创建 alertmanager.yml,内容如下:
1global:
2  smtp_smarthost: 'smtp.163.com:25'
3  smtp_from: 'xxxxx@163.com'
4  smtp_auth_username: 'xxxxx@163.com'
5  smtp_auth_password: 'xxxxx'
6
7route:
8  group_interval: 1m   #当第一个报警发送后,等待'group_interval'时间来发送新的一组报警信息
9  repeat_interval: 1m   # 如果一个报警信息已经发送成功了,等待'repeat_interval'时间来重新发送他们
10  receiver: 'mail-receiver'
11receivers:
12- name: 'mail-receiver'
13  email_configs:
14    - to: 'xxxxxx@163.com'
启动 AlertManager:
1docker run --name alertmanager -d -p 9093:9093 -v /Users/huanchu/Documents/alertmanager-data:/alertmanager-data \
2       prom/alertmanager --config.file=/alertmanager-data/alertmanager.yml
在Prometheus目录下,修改prometheus.yml配置Alertmanager地址:
1# Alertmanager configuration
2alerting:
3  alertmanagers:
4  - static_configs:
5    - targets:
6      - 192.168.43.121:9093
更新Prometheus配置:
curl -X POST http://localhost:9090/-/reload
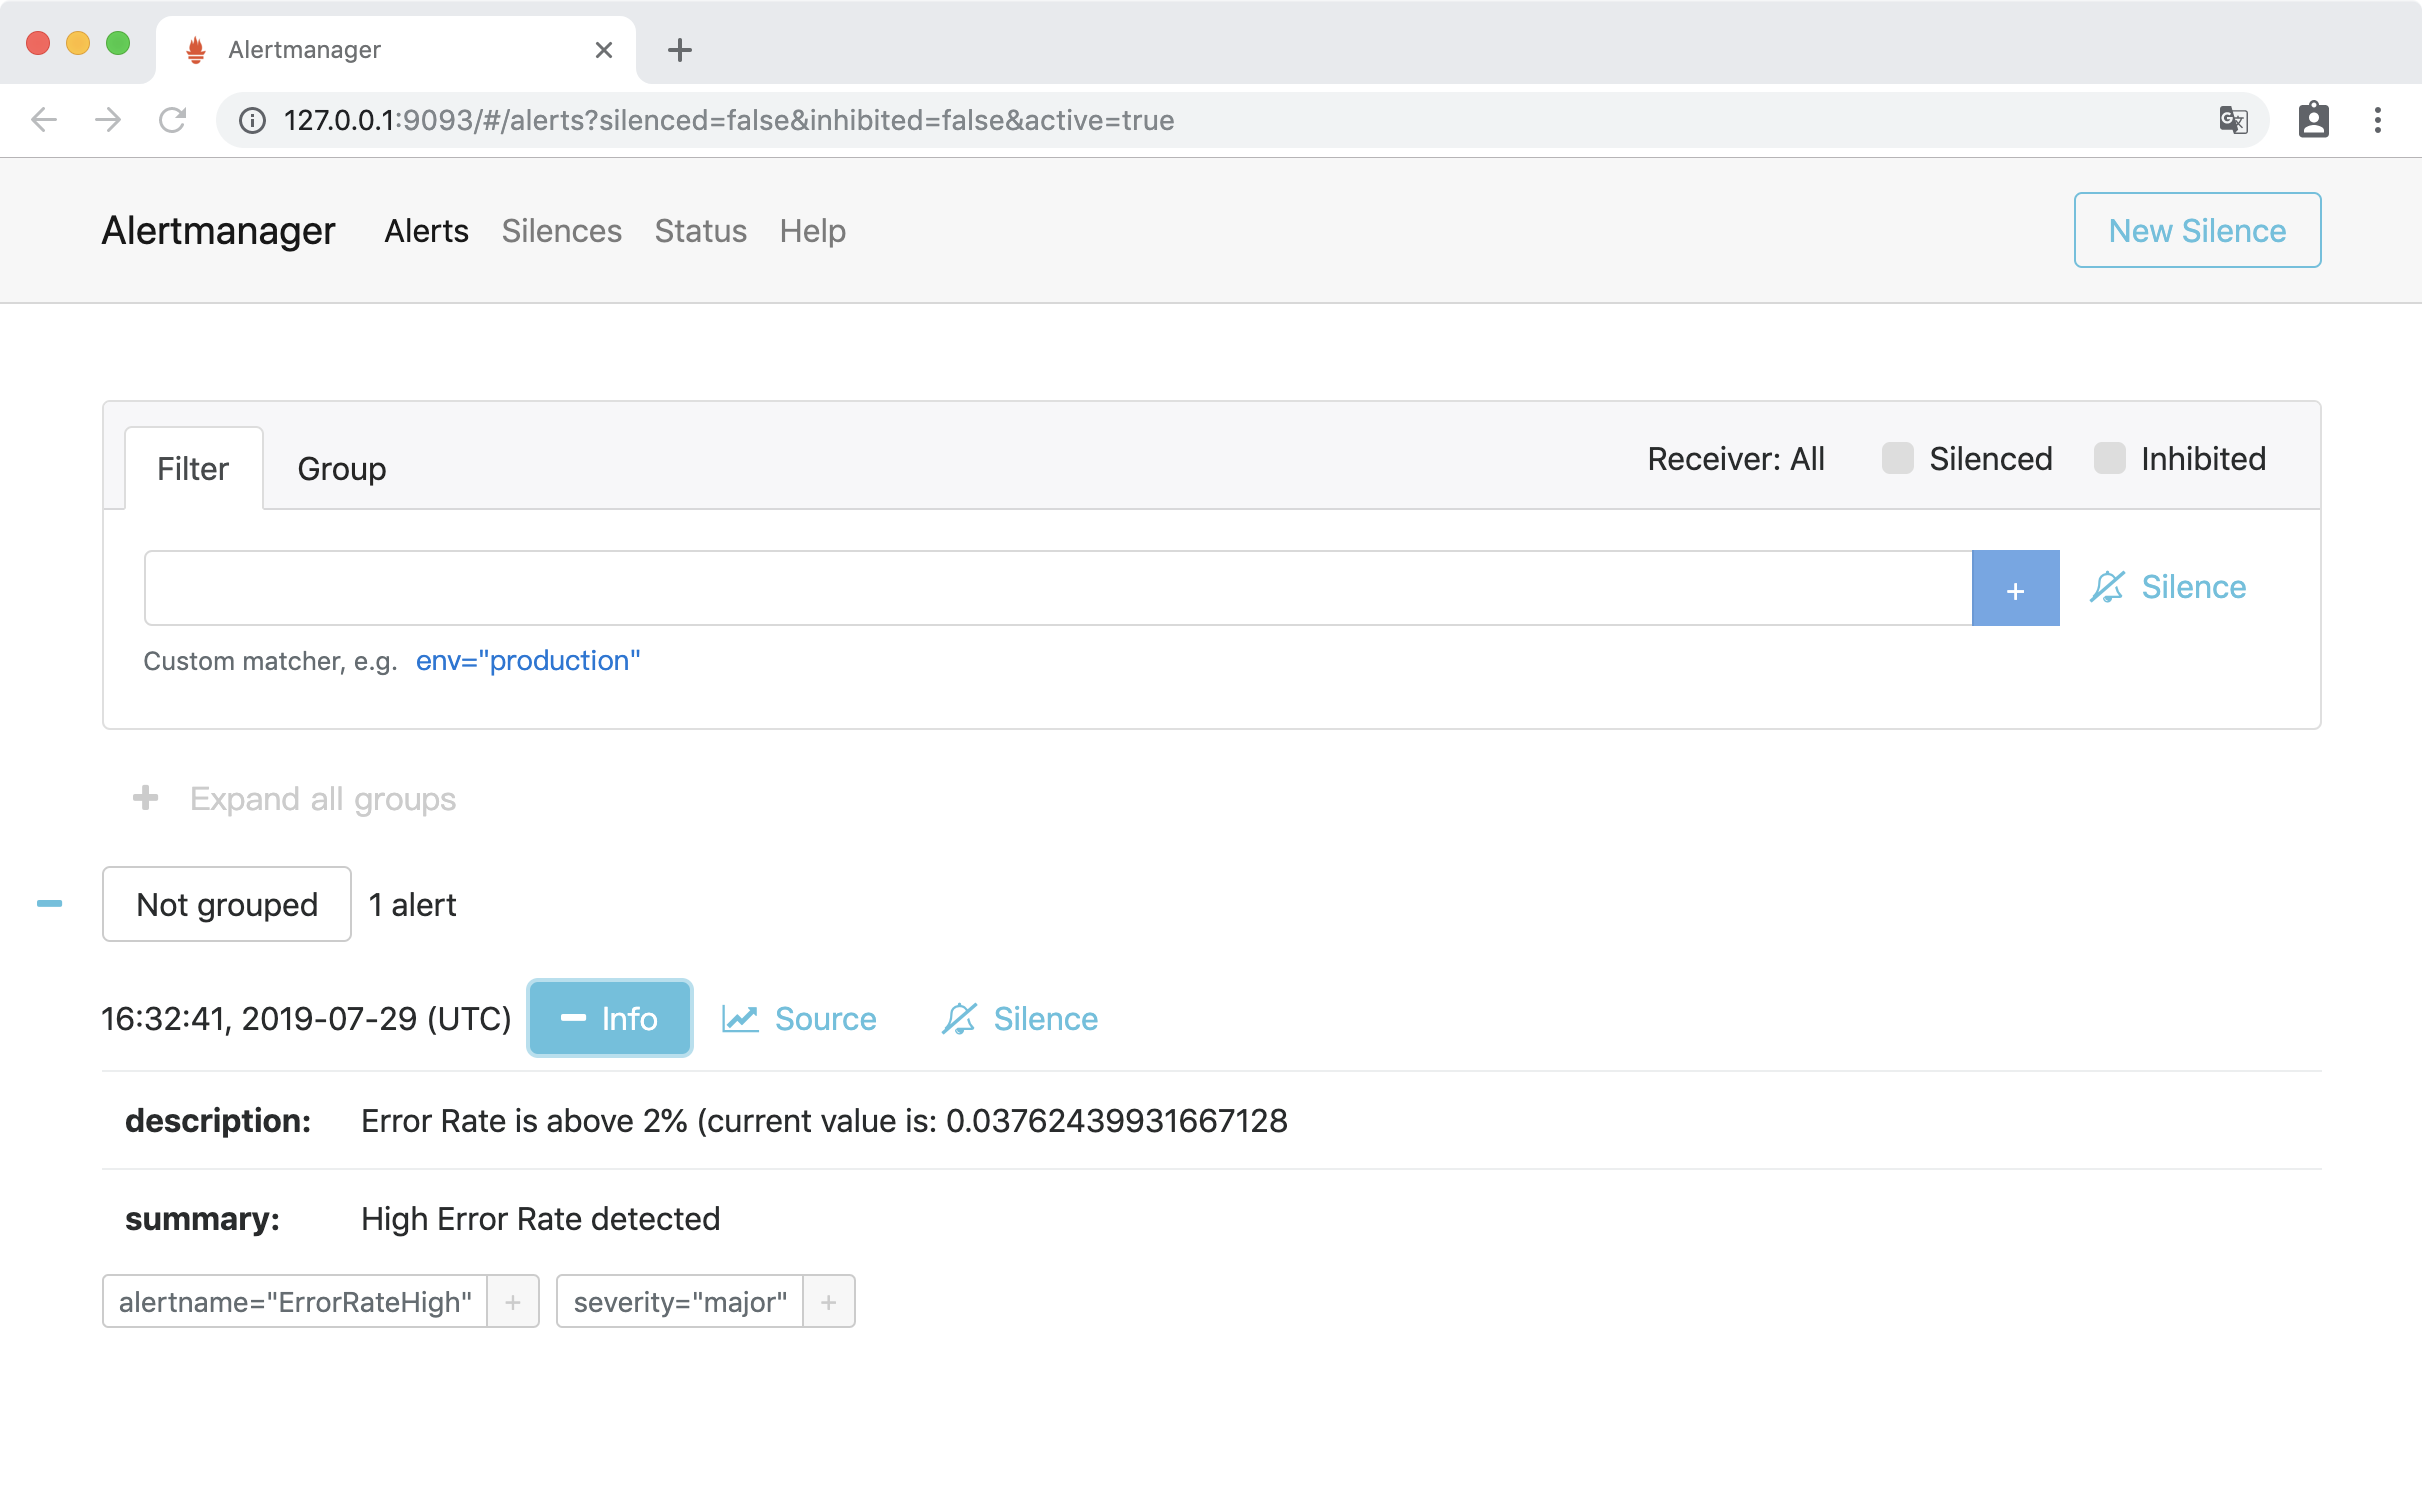
访问http://127.0.0.1:9093,访问Alertmanager UI界面,可以看到接收到ErrorRateHigh告警:
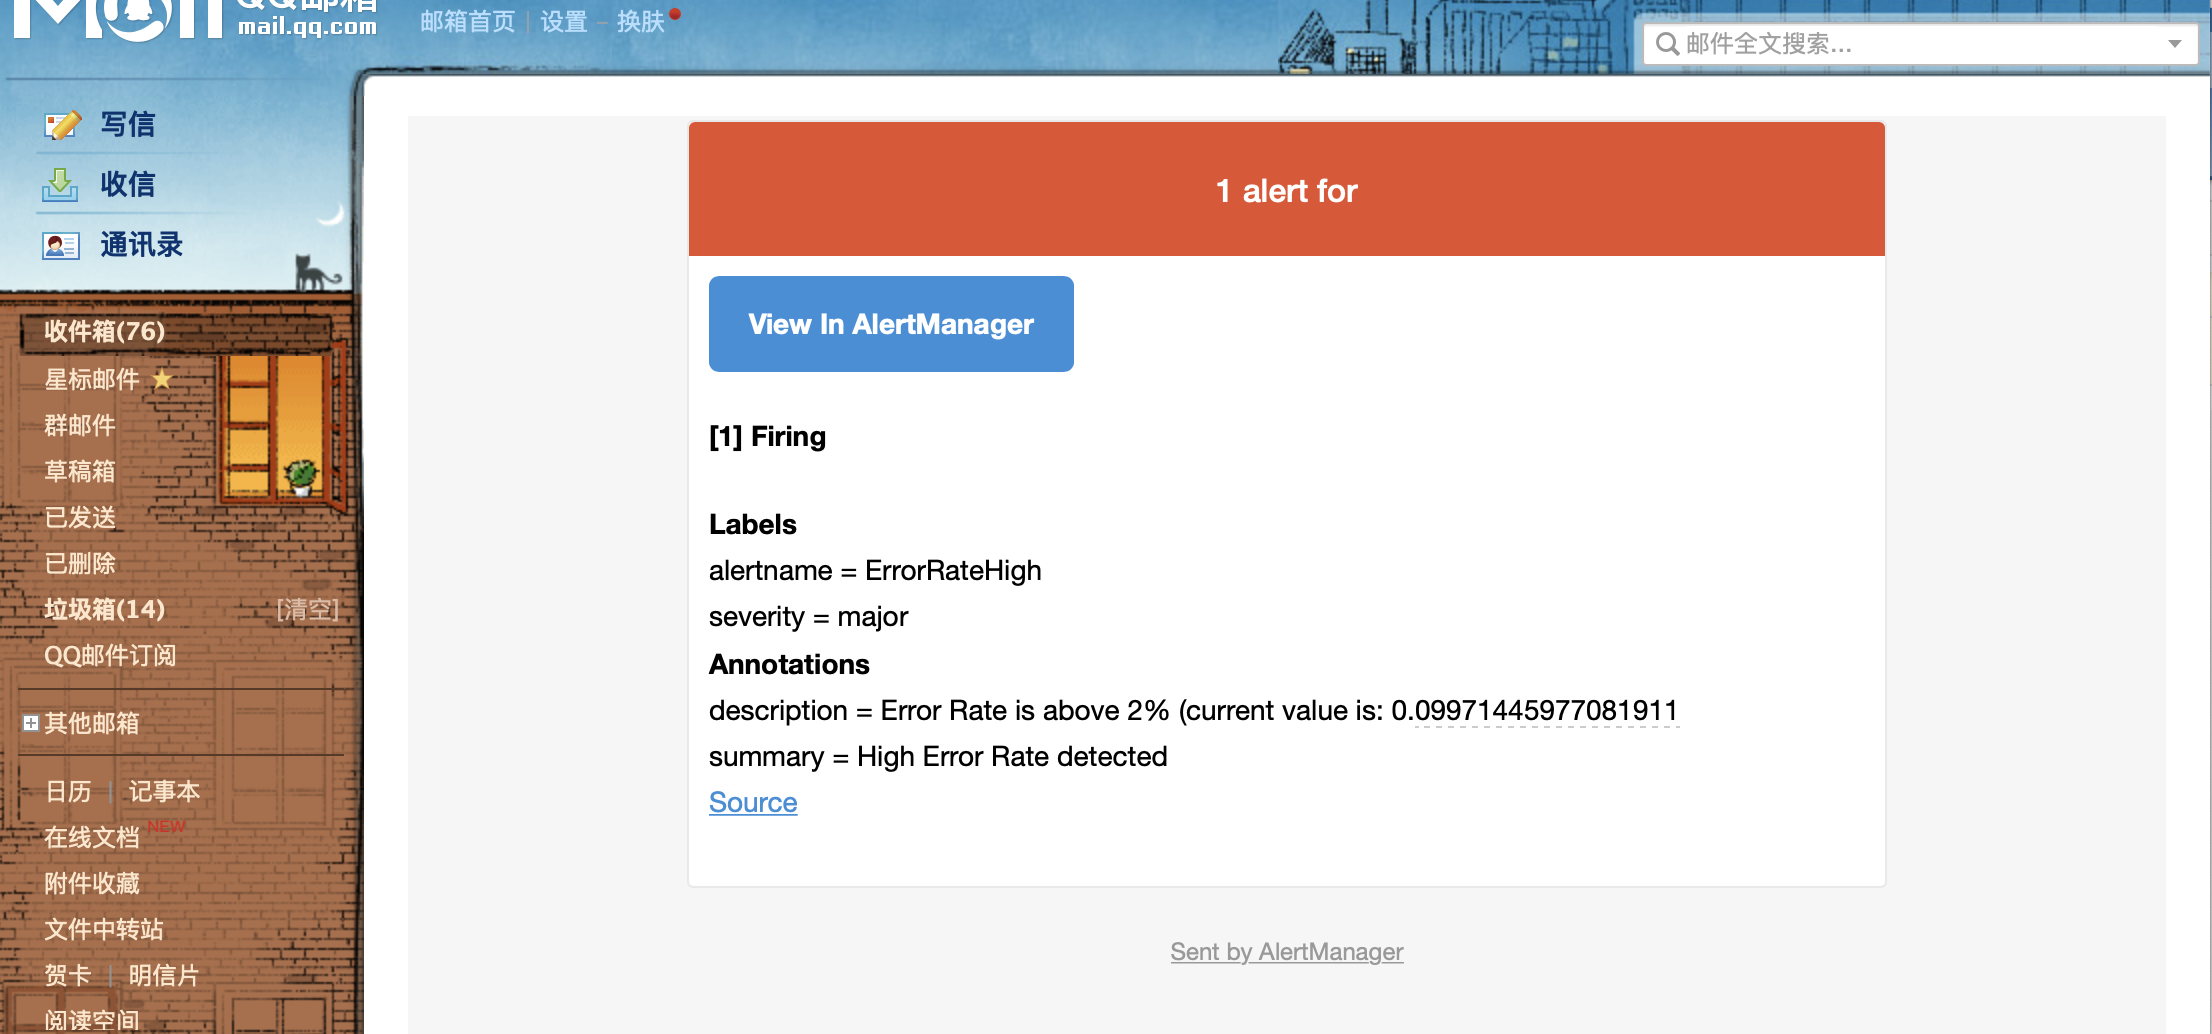
邮箱会收到告警信息:
关注我