
html:
1<div id="echartsDiv" style="width: 48%; height: 430px; float: left;">
2    </div>
3    <div id="tableDiv" style="width: 52%;float: left;">
4        <el-table :data="tableData"  border row-key="id" style="margin: 0 auto" :row-class-name="getRowClassName">
5            <el-table-column fixed type="index" label="序号"   align="center"  show-overflow-tooltip></el-table-column>
6            <el-table-column  fixed prop="sourceName" label="投诉方式" align="center"  show-overflow-tooltip></el-table-column>
7            <el-table-column prop="totalCount" label="数量"  align="center" show-overflow-tooltip></el-table-column>
8            <el-table-column prop="completedPercent" label="百分比"  align="center" show-overflow-tooltip></el-table-column>
9
10        </el-table>
11    </div>
js:
1var vue = new Vue({
2    el: '#app',
3    data: {
4        // 指定图表的配置项和数据
5        option : {
6            // 图标标题
7            title : {
8                text: '投诉方式统计',
9                x:'center'
10            },
11            // 提示框组件
12            tooltip : {
13                trigger: 'item',
14                // 字符串模板,饼图、仪表盘、漏斗图: {a}(系列名称),{b}(数据项名称),{c}(数值), {d}(百分比)
15                formatter: "{a}</br>{b} : {c} ({d}%)"
16            },
17            // 图例组件
18            legend : {
19                orient: 'horizontal',
20                bottom: 'bottom',
21                data: []
22            },
23            series : {
24                    name: '投诉方式',
25                    type: 'pie',
26                    radius : '50%',
27                    center: ['50%', '50%'],
28                    label : {
29                        normal : {
30                            show : true,
31                            formatter : "{b} : {c} ({d}%)"
32                        }
33                    },
34                    data:[],
35                    itemStyle: {
36                        emphasis: {
37                            shadowBlur: 10,
38                            shadowOffsetX: 0,
39                            shadowColor: 'rgba(0, 0, 0, 0.5)'
40                        }
41                    }
42                }
43
44        },// 接口返回的结果集合
45        backResultData:[],
46        // 表格数据
47        tableData:[],
48        // 行展开后的子表格数据
49        subTableData:[]
50    },
51
52successCallBack : function(result){
53                    if(result.success){
54                        // 接口返回的结果集合
55                        backResultData = result.data;
56                        // 设置饼图数据,普通for循环遍历,饼图去除总计列
57                        for(var i=0; i<result.data.length-1; i++){
58                            var resultData = result.data[i];
59                            if(!resultData.parentName){
60                                self.option.legend.data.push(resultData.sourceName);
61                                self.option.series.data.push({
62                                    value : parseInt(resultData.totalCount),
63                                    name : resultData.sourceName
64                                });
65                            }
66                        }
67                        // 设置表格数据
68                        for(var i=0; i<result.data.length; i++){
69                            // 取出返回结果集合中的对象
70                            changeObj = result.data[i];
71                            if(!changeObj.parentName){
72                                // 设置子表格数据
73                                for(var j=0; j<backResultData.length-1; j++){
74                                    if(backResultData[j].parentName==changeObj.sourceName){
75                                        self.subTableData.push(backResultData[j]);
76                                    }
77                                }
78                                // 给changeObj对象添加children属性,并赋值一个由接口返回列表中对象组成的数组
79                                changeObj.children=self.subTableData;
80                                self.tableData.push(changeObj);
81                            }
82                            // 存放子表格数据的数组每次父表元素之后都置空
83                            self.subTableData=[];
84                            // 百变对象置空
85                            changeObj={};
86                        }
87                        console.log(self.tableData);
88                        // 基于准备好的DOM,初始化echarts实例
89                        var myChart = echarts.init(document.getElementById('echartsDiv'));
90                        // 使用刚指定的配置项和数据显示图表
91                        myChart.setOption(self.option);
92                    }
93                }
效果:
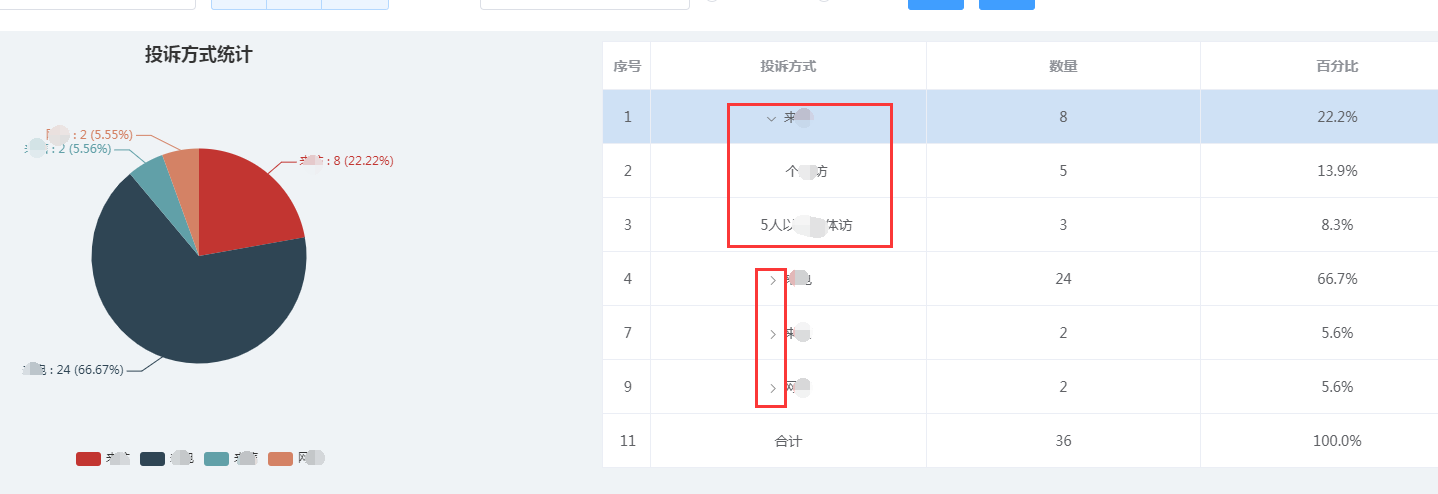
其中,只有element2.8及其以上版本才支持列表折叠子列表的,前面版本支持列表展开行是本行的详情信息;