
- Hey, 我是 沉浸式趣谈
- 本文首发于【沉浸式趣谈】,我的个人博客 https://yaolifeng.com 也同步更新。
- 转载请在文章开头注明出处和版权信息。
- 如果本文对您有所帮助,请 点赞、评论、转发,支持一下,谢谢!
- 该平台创作会佛系一点,更多文章在我的个人博客上更新,欢迎访问我的个人博客。
做前端的经常碰到这种需求:用户哗啦一下传个 Excel 上来,你得在网页上给它弄个像模像样的预览?有时候还要编辑,还挺折腾人的。
我踩了不少坑,也试了市面上挺多库,今天就聊聊几个比较主流的选择,特别是最后那个,我个人是强推!
在线预览 Demo
第一个选手:老牌劲旅 xlsx
提起处理 Excel,xlsx 这库估计是绕不过去的。GitHub 上 35k 的 star,简直是元老级别的存在了。
安装?老规矩:
1npm install xlsx
用起来嘛,也挺直接。看段代码感受下:
1<template>
2    <input type="file" @change="readExcel" />
3</template>
4
5<script setup>
6import { ref } from 'vue';
7import * as XLSX from 'xlsx';
8
9// 读取Excel文件
10const readExcel = event => {
11    const file = event.target.files[0];
12    const reader = new FileReader();
13    reader.onload = e => {
14        const data = new Uint8Array(e.target.result);
15        const workbook = XLSX.read(data, { type: 'array' });
16
17        // 获取第一个工作表
18        const firstSheet = workbook.Sheets[workbook.SheetNames[0]];
19
20        // 转换为JSON
21        const jsonData = XLSX.utils.sheet_to_json(firstSheet);
22        console.log('喏,JSON 数据到手:', jsonData);
23    };
24    reader.readAsArrayBuffer(file);
25};
26</script>
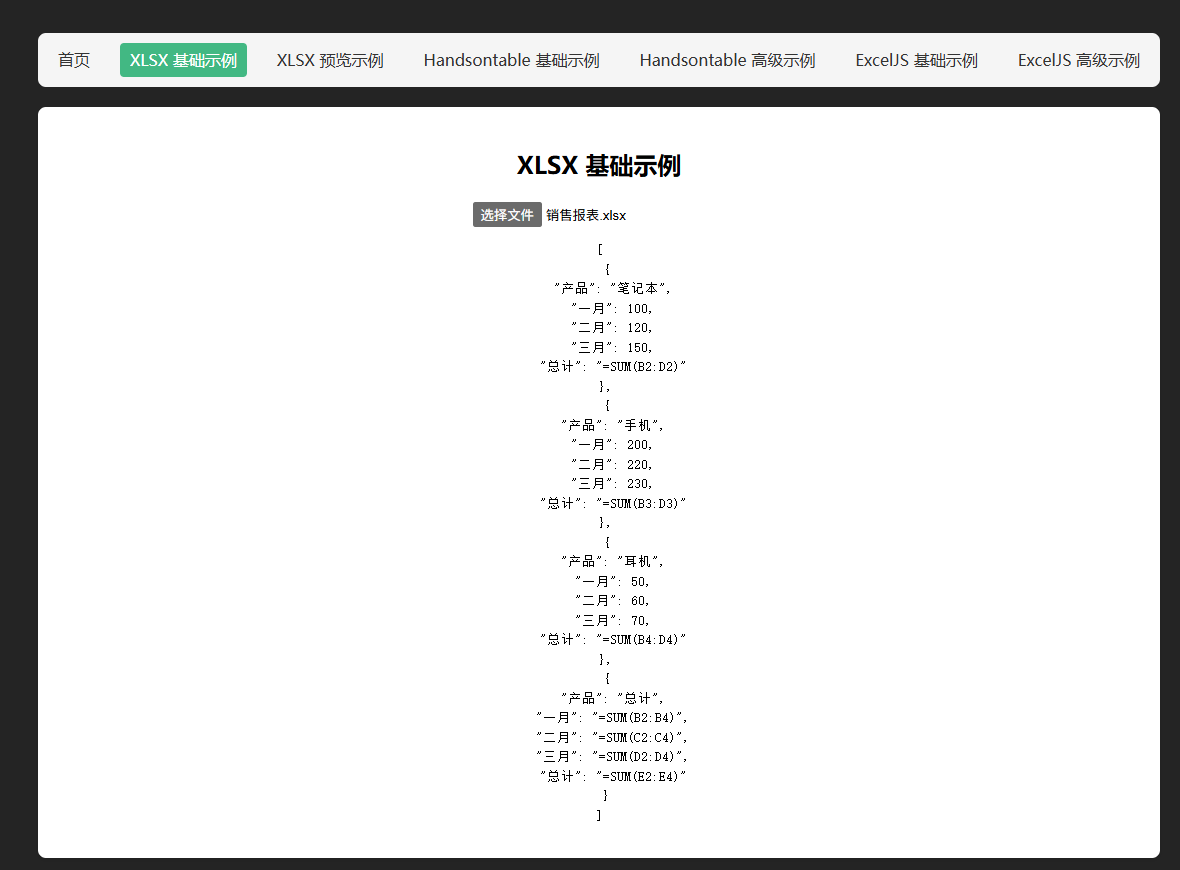
上面就是读个文件,拿到第一个 sheet 转成 JSON。很简单粗暴,对吧?
搞个带文件选择器的预览 Demo 也不复杂:
1<template>
2    <div>
3        <input type="file" accept=".xlsx,.xls" @change="handleFile" />
4
5        <div v-if="data.length > 0" style="overflow-x: auto; margin-top: 20px">
6            <table border="1" cellPadding="5" style="border-collapse: collapse">
7                <thead>
8                    <tr>
9                        <th v-for="(column, index) in columns" :key="index">
10                            {{ column.title }}
11                        </th>
12                    </tr>
13                </thead>
14                <tbody>
15                    <tr v-for="(row, rowIndex) in data" :key="rowIndex">
16                        <td v-for="(column, colIndex) in columns" :key="colIndex">
17                            {{ row[column.title] }}
18                        </td>
19                    </tr>
20                </tbody>
21            </table>
22        </div>
23    </div>
24</template>
25
26<script setup>
27import { ref } from 'vue';
28import * as XLSX from 'xlsx';
29
30const data = ref([]);
31const columns = ref([]);
32
33const handleFile = (e: Event) => {
34  const file = (e.target as HTMLInputElement).files?.[0];
35  if (!file) return;
36
37  const reader = new FileReader();
38  reader.onload = (event) => {
39    try {
40      // 修改变量名避免与外部响应式变量冲突
41      const fileData = new Uint8Array(event.target?.result as ArrayBuffer);
42      const workbook = XLSX.read(fileData, { type: 'array' });
43      const worksheet = workbook.Sheets[workbook.SheetNames[0]];
44
45      // 使用 header: 1 来获取原始数组格式
46      const jsonData = XLSX.utils.sheet_to_json(worksheet, { header: 1 });
47
48      if (jsonData.length > 0) {
49        // 第一行作为列标题
50        columns.value = jsonData[0] as string[];
51        // 其余行作为数据
52        data.value = jsonData.slice(1);
53        console.log('数据已加载:', { 列数: columns.value.length, 行数: data.value.length });
54      }
55    } catch (error) {
56      console.error('Excel解析失败:', error);
57      alert('文件解析失败,请检查文件格式');
58    }
59  };
60
61  reader.readAsArrayBuffer(file);
62};
63</script>
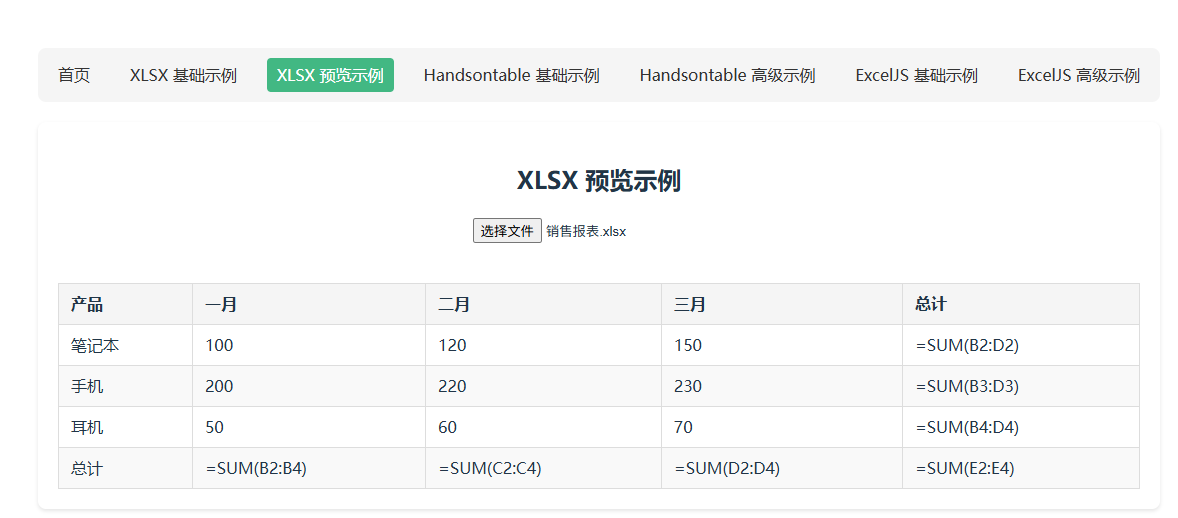
xlsx 这家伙吧,优点很明显: 轻、快!核心库体积不大,解析速度嗖嗖的,兼容性也不错,老格式新格式基本都能吃。社区也活跃,遇到问题谷歌一下大多有解。
但缺点也得说说: 它的 API 设计感觉有点…嗯…老派?或者说比较底层,不太直观。想拿到的数据结构,经常得自己再加工一道(就像上面 Demo 里那样)。而且,如果你想连着样式一起搞,比如单元格颜色、字体啥的,那 xlsx 就有点力不从心了,样式处理能力基本等于没有。
我个人觉得,如果你的需求就是简单读写数据,不关心样式,那 xlsx 绝对够用,效率杠杠的。但凡需求复杂一点,比如要高度还原 Excel 样式,或者处理复杂公式,那用它就有点“小马拉大车”的感觉了。
第二个选手:重量级嘉宾 Handsontable
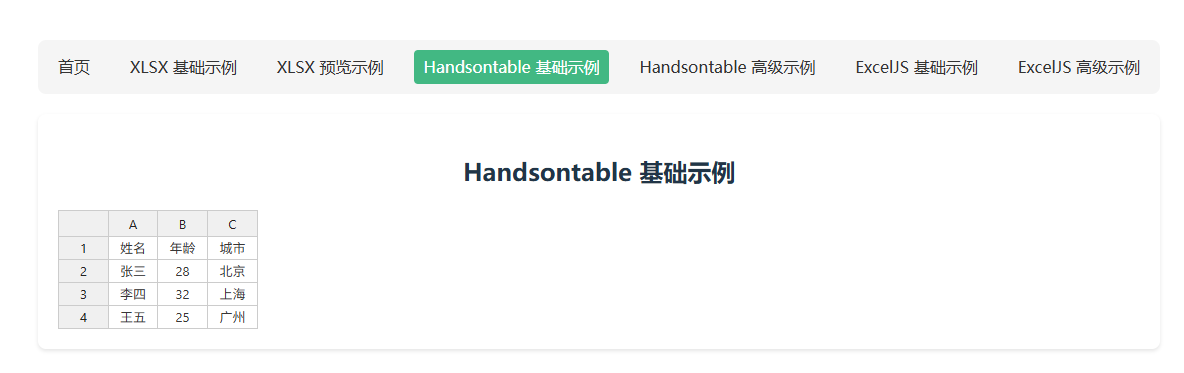
聊完基础款,我们来看个重量级的:Handsontable。这家伙最大的卖点,就是直接给你一个长得、用起来都跟 Excel 贼像的在线表格!
安装要多装个 Vue 的适配包:
1npm install handsontable
2npm install @handsontable/vue3  # Vue3 专用包
别忘了还有 CSS:
1import 'handsontable/dist/handsontable.full.css';
基础用法,它是在一个 DOM 容器里初始化:
1<template>
2    <div id="excel-preview"></div>
3</template>
4
5<script setup>
6import { onMounted } from 'vue';
7import Handsontable from 'handsontable';
8import 'handsontable/dist/handsontable.full.css';
9
10onMounted(() => {
11    // 初始化表格
12    const container = document.getElementById('excel-preview');
13    const hot = new Handsontable(container, {
14        data: [
15            ['姓名', '年龄', '城市'],
16            ['张三', 28, '北京'],
17            ['李四', 32, '上海'],
18            ['王五', 25, '广州'],
19        ],
20        rowHeaders: true,
21        colHeaders: true,
22        contextMenu: true,
23        licenseKey: 'non-commercial-and-evaluation', // 注意:商用要钱!这很关键!
24    });
25});
26</script>
搞个可编辑的 Demo 看看?这才是它的强项:
1<template>
2    <div class="handsontable-container">
3        <h2>Handsontable 数据分析工具</h2>
4
5        <div class="toolbar">
6            <div class="filter-section">
7                <label>部门过滤:</label>
8                <select v-model="selectedDepartment" @change="applyFilters">
9                    <option value="all">所有部门</option>
10                    <option value="销售">销售</option>
11                    <option value="市场">市场</option>
12                    <option value="技术">技术</option>
13                </select>
14            </div>
15
16            <div class="toolbar-actions">
17                <button @click="addNewRow">添加员工</button>
18                <button @click="saveData">保存数据</button>
19                <button @click="exportToExcel">导出Excel</button>
20            </div>
21        </div>
22
23        <hot-table
24            ref="hotTableRef"
25            :data="filteredData"
26            :colHeaders="headers"
27            :rowHeaders="true"
28            :width="'100%'"
29            :height="500"
30            :contextMenu="contextMenuOptions"
31            :columns="columnDefinitions"
32            :nestedHeaders="nestedHeaders"
33            :manualColumnResize="true"
34            :manualRowResize="true"
35            :colWidths="colWidths"
36            :beforeChange="beforeChangeHandler"
37            :afterChange="afterChangeHandler"
38            :cells="cellsRenderer"
39            licenseKey="non-commercial-and-evaluation"
40        ></hot-table>
41
42        <div class="summary-section">
43            <h3>数据统计</h3>
44            <div class="summary-items">
45                <div class="summary-item"> <strong>员工总数:</strong> {{ totalEmployees }} </div>
46                <div class="summary-item"> <strong>平均绩效分:</strong> {{ averagePerformance }} </div>
47                <div class="summary-item"> <strong>总薪资支出:</strong> {{ totalSalary }} </div>
48            </div>
49        </div>
50    </div>
51</template>
52
53<script setup lang="ts">
54import { ref, computed, onMounted } from 'vue';
55import { HotTable } from '@handsontable/vue3';
56import { registerAllModules } from 'handsontable/registry';
57import 'handsontable/dist/handsontable.full.css';
58import * as XLSX from 'xlsx';
59import Handsontable from 'handsontable';
60
61// 注册所有模块
62registerAllModules();
63
64// 表头定义
65const headers = ['ID', '姓名', '部门', '职位', '入职日期', '薪资', '绩效评分', '状态'];
66
67// 嵌套表头
68const nestedHeaders = [['员工基本信息', '', '', '', '员工绩效数据', '', '', ''], headers];
69
70// 列宽设置
71const colWidths = [60, 100, 100, 120, 120, 100, 100, 120];
72
73// 列定义
74const columnDefinitions = [
75    { data: 'id', type: 'numeric', readOnly: true },
76    { data: 'name', type: 'text' },
77    {
78        data: 'department',
79        type: 'dropdown',
80        source: ['销售', '市场', '技术', '人事', '财务'],
81    },
82    { data: 'position', type: 'text' },
83    {
84        data: 'joinDate',
85        type: 'date',
86        dateFormat: 'YYYY-MM-DD',
87        correctFormat: true,
88    },
89    {
90        data: 'salary',
91        type: 'numeric',
92        numericFormat: {
93            pattern: '¥ 0,0.00',
94            culture: 'zh-CN',
95        },
96    },
97    {
98        data: 'performance',
99        type: 'numeric',
100        numericFormat: {
101            pattern: '0.0',
102        },
103    },
104    {
105        data: 'status',
106        type: 'dropdown',
107        source: ['在职', '离职', '休假'],
108    },
109];
110
111// 右键菜单选项
112const contextMenuOptions = {
113    items: {
114        row_above: { name: '上方插入行' },
115        row_below: { name: '下方插入行' },
116        remove_row: { name: '删除行' },
117        separator1: Handsontable.plugins.ContextMenu.SEPARATOR,
118        copy: { name: '复制' },
119        cut: { name: '剪切' },
120        separator2: Handsontable.plugins.ContextMenu.SEPARATOR,
121        columns_resize: { name: '调整列宽' },
122        alignment: { name: '对齐' },
123    },
124};
125
126// 初始数据
127const initialData = [
128    {
129        id: 1,
130        name: '张三',
131        department: '销售',
132        position: '销售经理',
133        joinDate: '2022-01-15',
134        salary: 15000,
135        performance: 4.5,
136        status: '在职',
137    },
138    {
139        id: 2,
140        name: '李四',
141        department: '技术',
142        position: '高级开发',
143        joinDate: '2021-05-20',
144        salary: 18000,
145        performance: 4.7,
146        status: '在职',
147    },
148    {
149        id: 3,
150        name: '王五',
151        department: '市场',
152        position: '市场专员',
153        joinDate: '2022-03-10',
154        salary: 12000,
155        performance: 3.8,
156        status: '在职',
157    },
158    {
159        id: 4,
160        name: '赵六',
161        department: '技术',
162        position: '开发工程师',
163        joinDate: '2020-11-05',
164        salary: 16500,
165        performance: 4.2,
166        status: '在职',
167    },
168    {
169        id: 5,
170        name: '钱七',
171        department: '销售',
172        position: '销售代表',
173        joinDate: '2022-07-18',
174        salary: 10000,
175        performance: 3.5,
176        status: '休假',
177    },
178    {
179        id: 6,
180        name: '孙八',
181        department: '市场',
182        position: '市场总监',
183        joinDate: '2019-02-28',
184        salary: 25000,
185        performance: 4.8,
186        status: '在职',
187    },
188    {
189        id: 7,
190        name: '周九',
191        department: '技术',
192        position: '测试工程师',
193        joinDate: '2021-09-15',
194        salary: 14000,
195        performance: 4.0,
196        status: '在职',
197    },
198    {
199        id: 8,
200        name: '吴十',
201        department: '销售',
202        position: '销售代表',
203        joinDate: '2022-04-01',
204        salary: 11000,
205        performance: 3.6,
206        status: '离职',
207    },
208];
209
210// 表格引用
211const hotTableRef = ref(null);
212const data = ref([...initialData]);
213const selectedDepartment = ref('all');
214
215// 过滤后的数据
216const filteredData = computed(() => {
217    if (selectedDepartment.value === 'all') {
218        return data.value;
219    }
220    return data.value.filter(item => item.department === selectedDepartment.value);
221});
222
223// 数据统计
224const totalEmployees = computed(() => data.value.filter(emp => emp.status === '在职' || emp.status === '休假').length);
225
226const averagePerformance = computed(() => {
227    const activeEmployees = data.value.filter(emp => emp.status === '在职');
228    if (activeEmployees.length === 0) return 0;
229
230    const sum = activeEmployees.reduce((acc, emp) => acc + emp.performance, 0);
231    return (sum / activeEmployees.length).toFixed(1);
232});
233
234const totalSalary = computed(() => {
235    const activeEmployees = data.value.filter(emp => emp.status === '在职' || emp.status === '休假');
236    const sum = activeEmployees.reduce((acc, emp) => acc + emp.salary, 0);
237    return `¥ ${sum.toLocaleString('zh-CN')}`;
238});
239
240// 单元格渲染器 - 条件格式
241const cellsRenderer = (row, col, prop) => {
242    const cellProperties = {};
243
244    // 绩效评分条件格式
245    if (prop === 'performance') {
246        const value = filteredData.value[row]?.performance;
247
248        if (value >= 4.5) {
249            cellProperties.className = 'bg-green';
250        } else if (value >= 4.0) {
251            cellProperties.className = 'bg-light-green';
252        } else if (value < 3.5) {
253            cellProperties.className = 'bg-red';
254        }
255    }
256
257    // 状态条件格式
258    if (prop === 'status') {
259        const status = filteredData.value[row]?.status;
260
261        if (status === '在职') {
262            cellProperties.className = 'status-active';
263        } else if (status === '离职') {
264            cellProperties.className = 'status-inactive';
265        } else if (status === '休假') {
266            cellProperties.className = 'status-vacation';
267        }
268    }
269
270    return cellProperties;
271};
272
273// 数据验证
274const beforeChangeHandler = (changes, source) => {
275    if (source === 'edit') {
276        for (let i = 0; i < changes.length; i++) {
277            const [row, prop, oldValue, newValue] = changes[i];
278
279            // 薪资验证:不能小于0
280            if (prop === 'salary' && newValue < 0) {
281                changes[i][3] = oldValue;
282            }
283
284            // 绩效验证:范围1-5
285            if (prop === 'performance') {
286                if (newValue < 1) changes[i][3] = 1;
287                if (newValue > 5) changes[i][3] = 5;
288            }
289        }
290    }
291    return true;
292};
293
294// 在数据更改后的处理
295const afterChangeHandler = (changes, source) => {
296    if (!changes) return;
297
298    setTimeout(() => {
299        if (hotTableRef.value?.hotInstance) {
300            hotTableRef.value.hotInstance.render();
301        }
302    }, 0);
303};
304
305// 应用过滤器
306const applyFilters = () => {
307    if (hotTableRef.value?.hotInstance) {
308        hotTableRef.value.hotInstance.render();
309    }
310};
311
312// 添加新行
313const addNewRow = () => {
314    const newId = Math.max(...data.value.map(item => item.id), 0) + 1;
315    data.value.push({
316        id: newId,
317        name: '',
318        department: '',
319        position: '',
320        joinDate: new Date().toISOString().split('T')[0],
321        salary: 0,
322        performance: 3.0,
323        status: '在职',
324    });
325
326    if (hotTableRef.value?.hotInstance) {
327        setTimeout(() => {
328            hotTableRef.value.hotInstance.render();
329        }, 0);
330    }
331};
332
333// 保存数据
334const saveData = () => {
335    // 这里可以添加API保存逻辑
336    alert('数据已保存');
337};
338
339// 导出为Excel
340const exportToExcel = () => {
341    const currentData = data.value;
342    const ws = XLSX.utils.json_to_sheet(currentData);
343    const wb = XLSX.utils.book_new();
344    XLSX.utils.book_append_sheet(wb, ws, '员工数据');
345    XLSX.writeFile(wb, '员工数据报表.xlsx');
346};
347
348// 确保组件挂载后正确渲染
349onMounted(() => {
350    setTimeout(() => {
351        if (hotTableRef.value?.hotInstance) {
352            hotTableRef.value.hotInstance.render();
353        }
354    }, 100);
355});
356</script>
357
358<style>
359.handsontable-container {
360    padding: 20px;
361    font-family: Arial, sans-serif;
362}
363
364.toolbar {
365    display: flex;
366    justify-content: space-between;
367    margin-bottom: 20px;
368    align-items: center;
369}
370
371.filter-section {
372    display: flex;
373    align-items: center;
374    gap: 10px;
375}
376
377.toolbar-actions {
378    display: flex;
379    gap: 10px;
380}
381
382button {
383    padding: 8px 16px;
384    background-color: #4285f4;
385    color: white;
386    border: none;
387    border-radius: 4px;
388    cursor: pointer;
389    font-size: 14px;
390    transition: background-color 0.3s;
391}
392
393button:hover {
394    background-color: #3367d6;
395}
396
397select {
398    padding: 6px;
399    border-radius: 4px;
400    border: 1px solid #ccc;
401}
402
403.summary-section {
404    margin-top: 20px;
405    padding: 15px;
406    background-color: #f9f9f9;
407    border-radius: 6px;
408}
409
410.summary-items {
411    display: flex;
412    gap: 30px;
413    margin-top: 10px;
414}
415
416.summary-item {
417    padding: 10px;
418    background-color: white;
419    border-radius: 4px;
420    box-shadow: 0 1px 3px rgba(0, 0, 0, 0.1);
421}
422
423/* 条件格式样式 */
424.bg-green {
425    background-color: rgba(76, 175, 80, 0.3) !important;
426}
427
428.bg-light-green {
429    background-color: rgba(139, 195, 74, 0.2) !important;
430}
431
432.bg-red {
433    background-color: rgba(244, 67, 54, 0.2) !important;
434}
435
436.status-active {
437    font-weight: bold;
438    color: #2e7d32;
439}
440
441.status-inactive {
442    font-weight: bold;
443    color: #d32f2f;
444}
445
446.status-vacation {
447    font-weight: bold;
448    color: #f57c00;
449}
450</style>
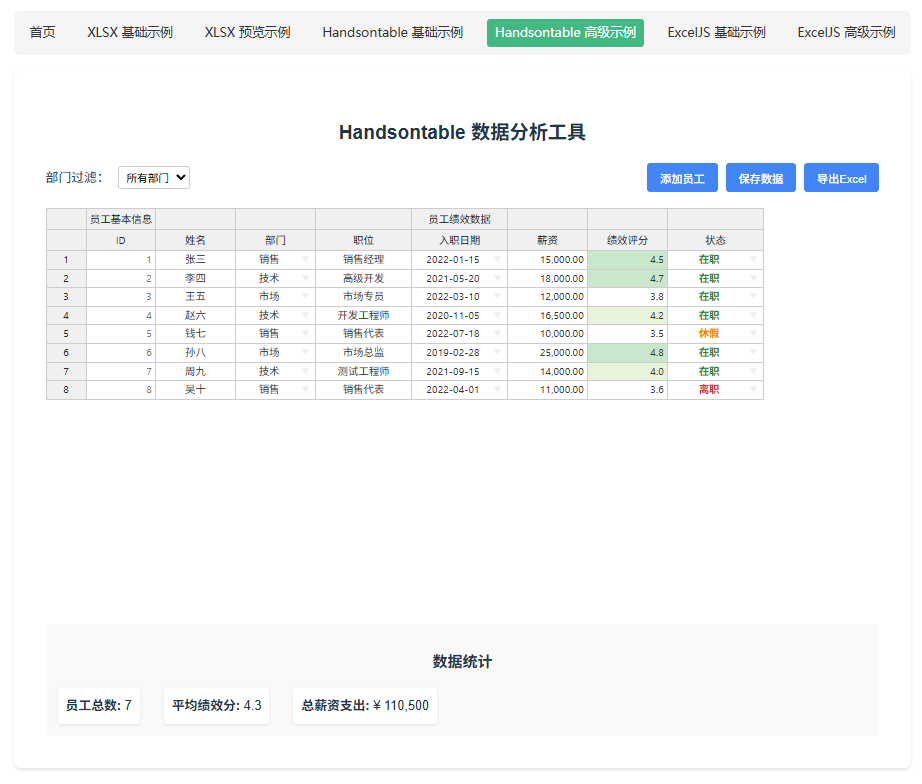
Handsontable 的牛逼之处: 界面无敌!
用户体验几乎无缝对接 Excel,什么排序、筛选、合并单元格、公式计算、右键菜单、拖拽调整行列,花里胡哨的功能一大堆。
定制性也强,事件钩子多得很。官方还贴心地提供了 Vue、React 这些框架的集成包。
但(总有个但是,对吧?):
贵! 商用许可不便宜,对不少项目来说是个门槛。虽然有非商用许可,但你懂的。
重! 功能全的代价就是体积大,加载可能慢一丢丢,尤其对性能敏感的页面。
大数据量有压力: 行列一多,性能可能会有点吃紧。
学习曲线: 配置项多如牛毛,想玩溜需要花点时间看文档。
我个人感觉,Handsontable 就像是你去了一家装修豪华、菜品精致的高档餐厅,体验一级棒,但结账时钱包会疼。
如果项目预算充足,而且用户强烈要求“就要 Excel 那样的体验”,那它确实是王炸。
压轴出场:我的心头好 ExcelJS
前面说了两个,一个轻快但简陋,一个豪华但贵重。
那有没有折中点的,功能强又免费的?
ExcelJS 登场!这家伙给我的感觉就是:现代化、全能型选手,而且 API 设计得相当舒服。
老规矩,安装
1npm install exceljs
基本用法,注意它用了 async/await,很现代:
1<template>
2    <input type="file" @change="readExcel" />
3</template>
4
5<script setup>
6import { ref } from 'vue';
7import ExcelJS from 'exceljs';
8
9const readExcel = async event => {
10    const file = event.target.files[0];
11    if (!file) return;
12
13    // 最好加个 try...catch
14    try {
15        const workbook = new ExcelJS.Workbook();
16        const arrayBuffer = await file.arrayBuffer(); // 直接读 ArrayBuffer,省事儿
17        await workbook.xlsx.load(arrayBuffer);
18
19        const worksheet = workbook.getWorksheet(1); // 获取第一个 worksheet
20        const data = [];
21
22        worksheet.eachRow((row, rowNumber) => {
23            const rowData = [];
24            row.eachCell((cell, colNumber) => {
25                rowData.push(cell.value);
26            });
27            // 它的 API 遍历起来就挺顺手
28            data.push(rowData);
29        });
30
31        console.log(data);
32        return data; // 返回解析好的数据
33    } catch (error) {
34        console.error('用 ExcelJS 解析失败了,检查下文件?', error);
35        alert('文件好像有点问题,解析不了哦');
36    }
37};
38</script>
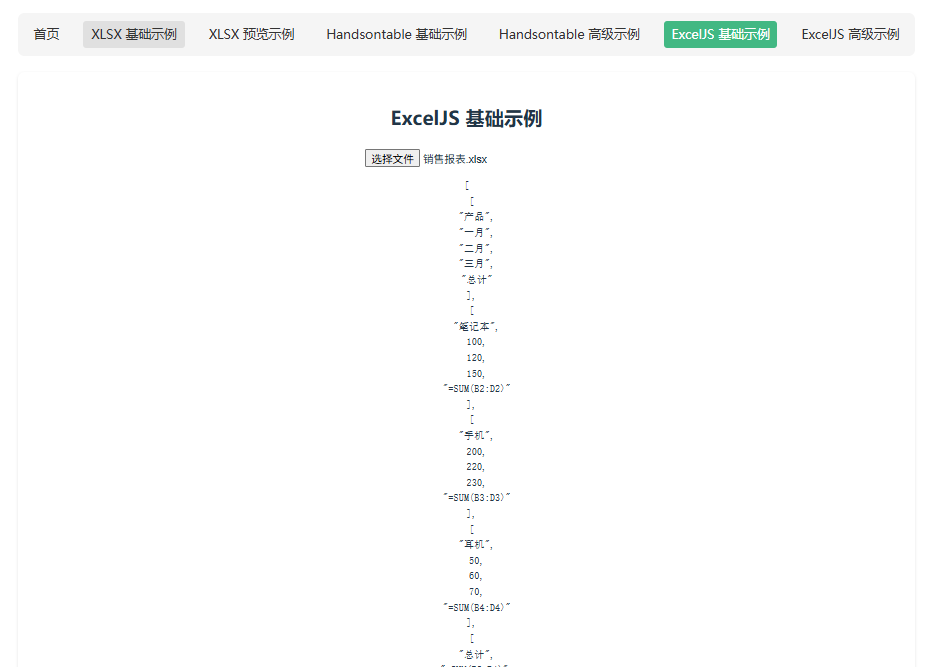
来个带劲的 Demo:把 Excel 样式也给你扒下来!
1<template>
2    <div>
3        <button @click="exportAdvancedExcel">导出进阶Excel</button>
4    </div>
5</template>
6
7<script setup lang="ts">
8import ExcelJS from 'exceljs';
9
10// 高级数据类型
11interface AdvancedData {
12    id: number;
13    name: string;
14    department: string;
15    salary: number;
16    joinDate: Date;
17    performance: number;
18}
19
20// 生成示例数据
21const generateData = () => {
22    const data: AdvancedData[] = [];
23    for (let i = 1; i <= 5; i++) {
24        data.push({
25            id: i,
26            name: `员工${i}`,
27            department: ['技术部', '市场部', '财务部'][i % 3],
28            salary: 10000 + i * 1000,
29            joinDate: new Date(2020 + i, i % 12, i),
30            performance: Math.random() * 100,
31        });
32    }
33    return data;
34};
35
36const exportAdvancedExcel = async () => {
37    const workbook = new ExcelJS.Workbook();
38    const worksheet = workbook.addWorksheet('员工报表');
39
40    // 设置文档属性
41    workbook.creator = '企业管理系统';
42    workbook.lastModifiedBy = '管理员';
43    workbook.created = new Date();
44
45    // 设置页面布局
46    worksheet.pageSetup = {
47        orientation: 'landscape',
48        margins: { left: 0.7, right: 0.7, top: 0.75, bottom: 0.75 },
49    };
50
51    // 创建自定义样式
52    const headerStyle = {
53        font: { bold: true, color: { argb: 'FFFFFFFF' } },
54        fill: { type: 'pattern', pattern: 'solid', fgColor: { argb: 'FF4F81BD' } },
55        border: {
56            top: { style: 'thin' },
57            left: { style: 'thin' },
58            bottom: { style: 'thin' },
59            right: { style: 'thin' },
60        },
61        alignment: { vertical: 'middle', horizontal: 'center' },
62    };
63
64    const moneyFormat = '"¥"#,##0.00';
65    const dateFormat = 'yyyy-mm-dd';
66    const percentFormat = '0.00%';
67
68    // 合并标题行
69    worksheet.mergeCells('A1:F1');
70    const titleCell = worksheet.getCell('A1');
71    titleCell.value = '2023年度员工数据报表';
72    titleCell.style = {
73        font: { size: 18, bold: true, color: { argb: 'FF2E75B5' } },
74        alignment: { vertical: 'middle', horizontal: 'center' },
75    };
76
77    // 设置列定义
78    worksheet.columns = [
79        { header: '工号', key: 'id', width: 10 },
80        { header: '姓名', key: 'name', width: 15 },
81        { header: '部门', key: 'department', width: 15 },
82        {
83            header: '薪资',
84            key: 'salary',
85            width: 15,
86            style: { numFmt: moneyFormat },
87        },
88        {
89            header: '入职日期',
90            key: 'joinDate',
91            width: 15,
92            style: { numFmt: dateFormat },
93        },
94        {
95            header: '绩效',
96            key: 'performance',
97            width: 15,
98            style: { numFmt: percentFormat },
99        },
100    ];
101
102    // 应用表头样式
103    worksheet.getRow(2).eachCell(cell => {
104        cell.style = headerStyle;
105    });
106
107    // 添加数据
108    const data = generateData();
109    worksheet.addRows(data);
110
111    // 添加公式行
112    const totalRow = worksheet.addRow({
113        id: '总计',
114        salary: { formula: 'SUM(D3:D7)' },
115        performance: { formula: 'AVERAGE(F3:F7)' },
116    });
117
118    // 设置总计行样式
119    totalRow.eachCell(cell => {
120        cell.style = {
121            font: { bold: true },
122            fill: { type: 'pattern', pattern: 'solid', fgColor: { argb: 'FFFCE4D6' } },
123        };
124    });
125
126    // 添加条件格式
127    worksheet.addConditionalFormatting({
128        ref: 'F3:F7',
129        rules: [
130            {
131                type: 'cellIs',
132                operator: 'greaterThan',
133                formulae: [0.8],
134                style: { fill: { type: 'pattern', pattern: 'solid', fgColor: { argb: 'FFC6EFCE' } } },
135            },
136        ],
137    });
138
139    // 生成Blob并下载
140    const buffer = await workbook.xlsx.writeBuffer();
141    const blob = new Blob([buffer], {
142        type: 'application/vnd.openxmlformats-officedocument.spreadsheetml.sheet',
143    });
144
145    // 使用原生API下载
146    const url = URL.createObjectURL(blob);
147    const link = document.createElement('a');
148    link.href = url;
149    link.download = '员工报表.xlsx';
150    document.body.appendChild(link);
151    link.click();
152    document.body.removeChild(link);
153    URL.revokeObjectURL(url);
154};
155</script>
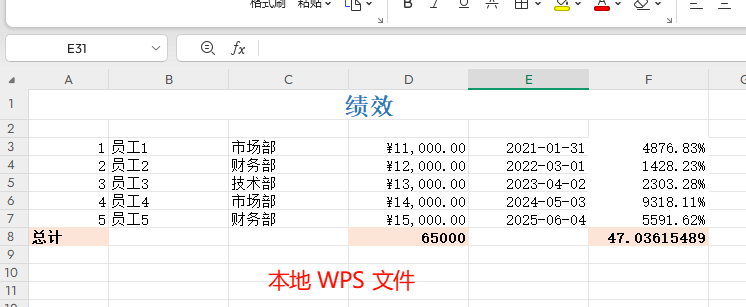
为啥我偏爱 ExcelJS?
API 友好: Promise 风格,链式调用,写起来舒服,代码也更易读。感觉就是为现代 JS 开发设计的。
功能全面: 不仅仅是读写数据,样式、公式、合并单元格、图片、表单控件… 它支持的 Excel 特性相当多。特别是读取和修改样式,这对于需要“还原”Excel 样貌的场景太重要了!
免费开源! 这点太香了,没有商业使用的后顾之忧。
文档清晰: 官方文档写得挺明白,示例也足。
当然,没啥是完美的:
体积比 xlsx 大点: 但功能也强得多嘛,可以接受。
复杂公式支持可能有限: 极其复杂的嵌套公式或者宏,可能还是搞不定(不过大部分场景够用了)。
超大文件性能: 几十上百兆的 Excel,解析起来可能会慢,或者内存占用高点(老实说,哪个库处理这种文件不头疼呢)。
我之前用 xlsx 时,老是要自己写一堆转换逻辑,数据结构处理起来烦得很。换了 ExcelJS 后,感觉世界清净了不少。尤其是它能把单元格的背景色、字体、边框这些信息都读出来,这对做预览太有用了!
实战中怎么选?或者…全都要?
其实吧,这三个库也不是非得“你死我活”。在真实项目中,完全可以根据情况搭配使用:
简单快速的导入导出: 用户上传个模板,或者导出一份简单数据,用 xlsx 就行,轻快好省。
需要精确保留样式或复杂解析: 用户传了个带格式的报表,你想尽可能还原预览,那 ExcelJS 就是主力。
需要在线编辑、强交互: 如果你做的不是预览,而是个在线的类 Excel 编辑器,那砸钱上 Handsontable 可能是最接近目标的(如果预算允许的话)。
我甚至见过有项目是这样搞的:先用 xlsx 快速读取基本数据和 Sheet 名称做个“秒开”预览,然后后台或者异步再用 ExcelJS 做详细的、带样式的解析。
这样既快,又能保证最终效果。
下面这个(伪)代码片段,大概是这个思路:
1<template>
2    <div class="excel-viewer">
3        <div class="controls">
4            <input type="file" @change="e => detailedParse(e.target.files[0])" accept=".xlsx,.xls" />
5            <button @click="exportToExcel">导出Excel</button>
6        </div>
7
8        <div v-if="isLoading">加载中...</div>
9
10        <template v-else>
11            <div v-if="sheetNames.length > 0" class="sheet-tabs">
12                <button
13                    v-for="(name, index) in sheetNames"
14                    :key="index"
15                    :class="{ active: activeSheet === index }"
16                    @click="handleSheetChange(index)"
17                >
18                    {{ name }}
19                </button>
20            </div>
21
22            <hot-table
23                v-if="data.length > 0"
24                ref="hotTableRef"
25                :data="data"
26                :rowHeaders="true"
27                :colHeaders="true"
28                :width="'100%'"
29                :height="400"
30                licenseKey="non-commercial-and-evaluation"
31            ></hot-table>
32        </template>
33    </div>
34</template>
35
36<script setup>
37import { ref } from 'vue';
38import * as XLSX from 'xlsx'; // 用于快速预览 & 导出
39import ExcelJS from 'exceljs'; // 用于详细解析
40import { HotTable } from '@handsontable/vue3'; // 用于展示 & 编辑
41import 'handsontable/dist/handsontable.full.css';
42
43const data = ref([]);
44const isLoading = ref(false);
45const sheetNames = ref([]);
46const activeSheet = ref(0);
47const hotTableRef = ref(null);
48
49// 快速预览(可选,或者直接用 detailedParse)
50const quickPreview = file => {
51    isLoading.value = true;
52    const reader = new FileReader();
53    reader.onload = e => {
54        try {
55            const data = new Uint8Array(e.target.result);
56            const workbook = XLSX.read(data, { type: 'array' });
57            sheetNames.value = workbook.SheetNames;
58
59            const firstSheet = workbook.Sheets[workbook.SheetNames[0]];
60            const jsonData = XLSX.utils.sheet_to_json(firstSheet, { header: 1 });
61            data.value = jsonData;
62            activeSheet.value = 0;
63        } catch (error) {
64            console.error('预览失败:', error);
65            alert('文件预览失败');
66        } finally {
67            isLoading.value = false;
68        }
69    };
70    reader.readAsArrayBuffer(file);
71};
72
73// 使用ExcelJS详细解析
74const detailedParse = async file => {
75    isLoading.value = true;
76    try {
77        const workbook = new ExcelJS.Workbook();
78        const arrayBuffer = await file.arrayBuffer();
79        await workbook.xlsx.load(arrayBuffer);
80
81        // 也许这里还可以把 ExcelJS 解析到的样式信息存起来,以后可能用得到
82        // 比如,导出时尝试用 ExcelJS 写回样式?那就更高级了
83        const names = workbook.worksheets.map(sheet => sheet.name);
84        sheetNames.value = names;
85
86        // 解析第一个 sheet
87        parseWorksheet(workbook.worksheets[0]);
88        activeSheet.value = 0;
89    } catch (error) {
90        console.error('解析失败:', error);
91        alert('文件解析失败');
92    } finally {
93        isLoading.value = false;
94    }
95};
96
97// 解析某个 worksheet 并更新 Handsontable 数据
98const parseWorksheet = worksheet => {
99    const sheetData = [];
100    worksheet.eachRow((row, rowNumber) => {
101        const rowData = [];
102        row.eachCell((cell, colNumber) => {
103            let value = cell.value;
104            // 处理日期等特殊类型
105            if (value instanceof Date) {
106                value = value.toLocaleDateString();
107            }
108            rowData.push(value);
109        });
110        sheetData.push(rowData);
111    });
112    // 这里的 data 结构要适配 Handsontable,通常是二维数组
113    data.value = sheetData;
114};
115
116// 切换 Sheet (需要重新调用 parseWorksheet)
117const handleSheetChange = async index => {
118    activeSheet.value = index;
119    // 重新加载并解析对应 Sheet 的数据... 这需要保存 workbook 实例
120    // 或者在 detailedParse 时就把所有 sheet 数据都解析缓存起来?看内存消耗
121};
122
123// 导出 (简单起见,用 xlsx 快速导出当前 Handsontable 的数据)
124const exportToExcel = () => {
125    const ws = XLSX.utils.aoa_to_sheet(data.value);
126    const wb = XLSX.utils.book_new();
127    XLSX.utils.book_append_sheet(wb, ws, 'Sheet1');
128    XLSX.writeFile(wb, '导出数据.xlsx');
129    // 如果想导出带样式的,那得用 ExcelJS 来写,会复杂不少
130};
131</script>
132
133<style scoped>
134.excel-viewer {
135    margin: 20px;
136}
137.controls {
138    margin-bottom: 15px;
139}
140.sheet-tabs {
141    display: flex;
142    margin-bottom: 10px;
143}
144.sheet-tabs button {
145    padding: 5px 10px;
146    margin-right: 5px;
147    border: 1px solid #ccc;
148    background: #f5f5f5;
149    cursor: pointer;
150}
151.sheet-tabs button.active {
152    background: #e0e0e0;
153    border-bottom: 2px solid #1890ff;
154}
155</style>
总结一下我的个人看法:
折腾下来,这几个库真是各有千秋:
xlsx (SheetJS): 老司机,适合追求极致性能和体积的简单场景。代码写得少,跑得快,但不怎么讲究“内饰”(样式)。
Handsontable: 豪华座驾,提供近乎完美的 Excel 编辑体验。功能强大没得说,但得看你口袋里的银子够不够。
ExcelJS: 可靠的全能伙伴。API 现代,功能均衡,对样式支持好,关键还免费!能帮你解决绝大多数问题。
说真的,没有银弹。选哪个,最终还是看你的具体需求和项目限制。
但如果非要我推荐一个,我绝对站 ExcelJS。
在功能、易用性和成本(免费!)之间,它平衡得太好了。
对于大部分需要精细处理 Excel 文件(尤其是带样式预览)的场景,它就是那个最香的选择!
好了,就叨叨这么多,希望能帮到你!赶紧去试试吧!