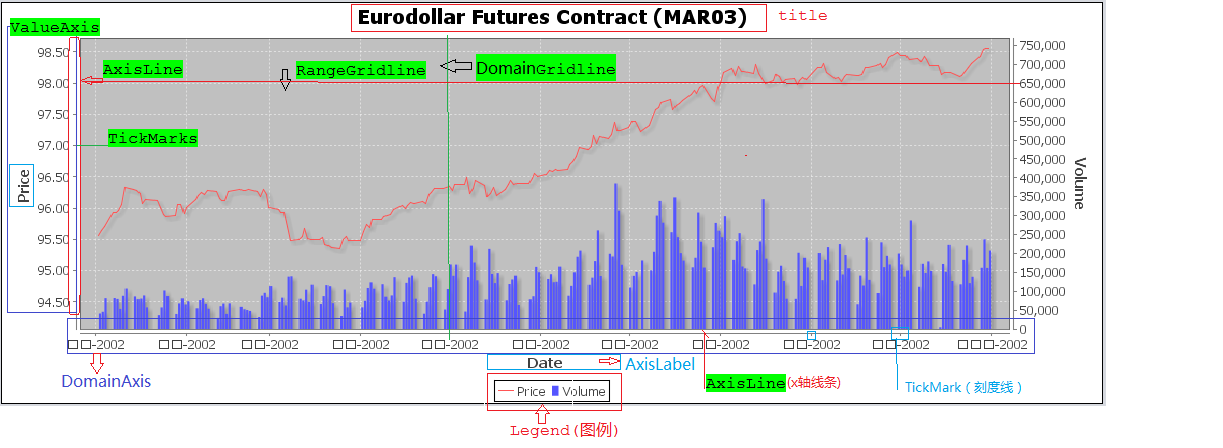
要想绘制出漂亮的图表,就必须了解图表的构成部分,将图表进行分解成N个部分。
然后再对每一个部分进行渲染,设置样式:包括背景色、轮廓线条样式和颜色、填充颜色、字体大小、样式、颜色。同时,需要确保在整个项目中,图表的样式风格整体统一,统一,和谐才能打造漂亮、干净、专业的外观.
- 使用JfreeChart创建柱状图,折线图,饼图,堆积柱状图,时间序列图,二维Y轴坐标图.
- 所有代码和示例项目代码地址:http://www.oschina.net/code/snippet_855019_36505
- 封装好的美化Jfreechart的工具类 ChartUtils.java 大家可以直接使用.
- Jfreechart API详解和开发中大家所经常遇到的问题,请参考博客:http://my.oschina.net/abian/blog/278465
- Jfreechart 图表属性拆解图:
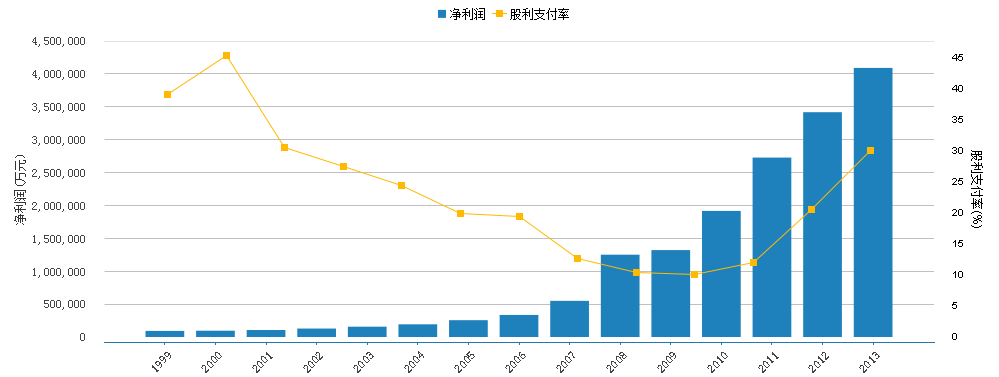
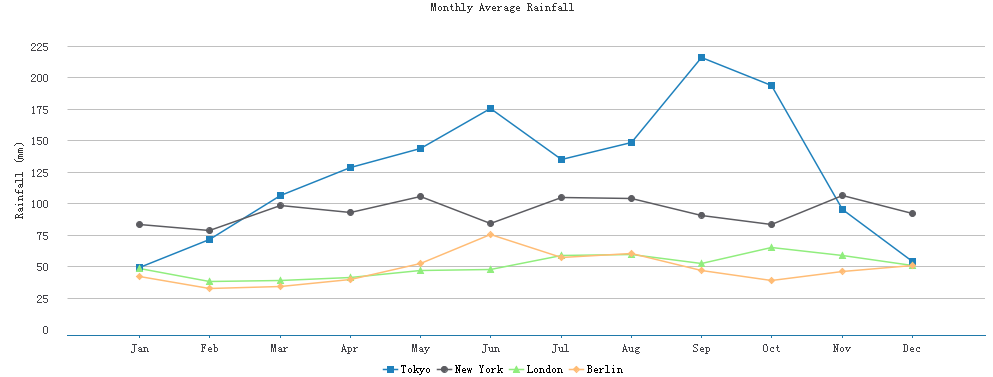
美化后,Jfreechart图形效果展示:
柱状图界面:
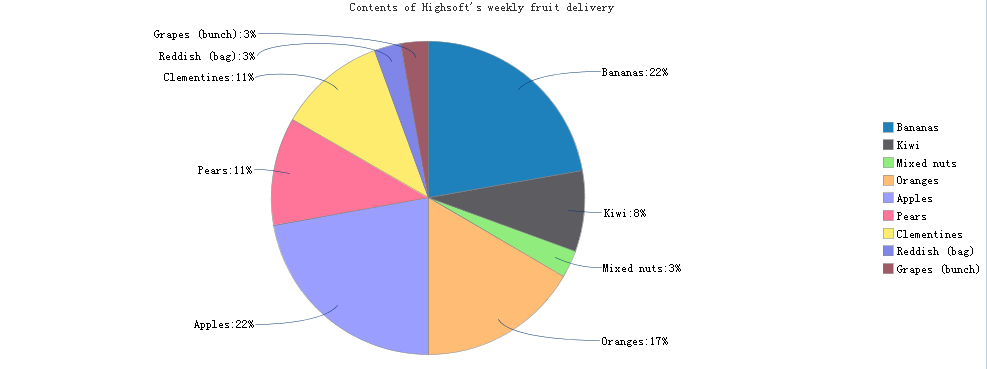
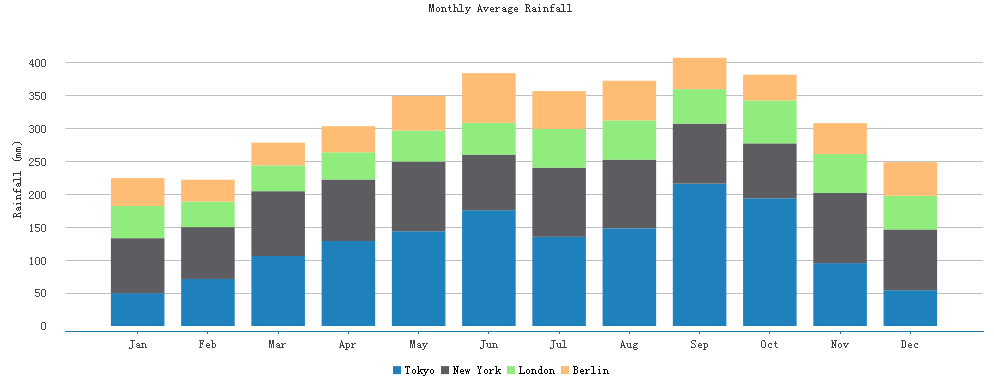
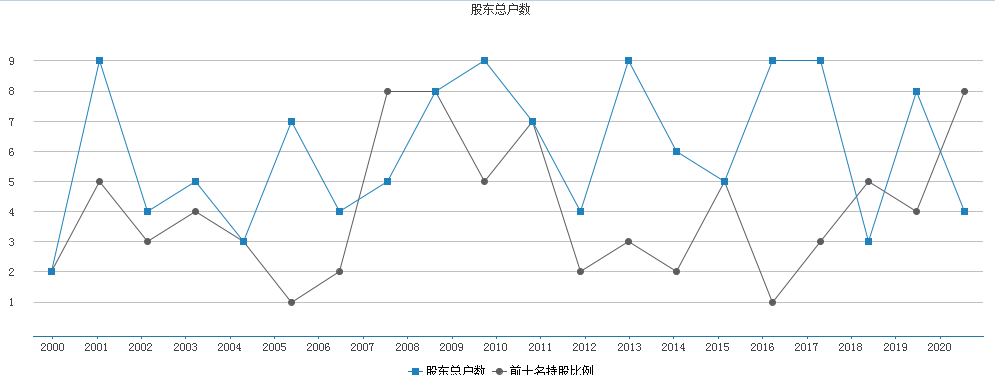
代码:这是我封装的工具类,然后绘制图表就非常简单了,而且美观专业!
1package util;
2
3import java.awt.BasicStroke;
4import java.awt.Color;
5import java.awt.Font;
6import java.awt.Paint;
7import java.awt.Rectangle;
8import java.text.DecimalFormat;
9import java.text.NumberFormat;
10import java.text.ParseException;
11import java.text.SimpleDateFormat;
12import java.util.Date;
13import java.util.Vector;
14
15import org.jfree.chart.ChartFactory;
16import org.jfree.chart.JFreeChart;
17import org.jfree.chart.StandardChartTheme;
18import org.jfree.chart.axis.DateAxis;
19import org.jfree.chart.axis.DateTickUnit;
20import org.jfree.chart.axis.DateTickUnitType;
21import org.jfree.chart.axis.ValueAxis;
22import org.jfree.chart.block.BlockBorder;
23import org.jfree.chart.labels.ItemLabelAnchor;
24import org.jfree.chart.labels.ItemLabelPosition;
25import org.jfree.chart.labels.StandardCategoryItemLabelGenerator;
26import org.jfree.chart.labels.StandardPieSectionLabelGenerator;
27import org.jfree.chart.labels.StandardXYItemLabelGenerator;
28import org.jfree.chart.labels.StandardXYToolTipGenerator;
29import org.jfree.chart.plot.CategoryPlot;
30import org.jfree.chart.plot.DefaultDrawingSupplier;
31import org.jfree.chart.plot.PieLabelLinkStyle;
32import org.jfree.chart.plot.PiePlot;
33import org.jfree.chart.plot.Plot;
34import org.jfree.chart.plot.XYPlot;
35import org.jfree.chart.renderer.category.BarRenderer;
36import org.jfree.chart.renderer.category.LineAndShapeRenderer;
37import org.jfree.chart.renderer.category.StackedBarRenderer;
38import org.jfree.chart.renderer.category.StandardBarPainter;
39import org.jfree.chart.renderer.xy.StandardXYBarPainter;
40import org.jfree.chart.renderer.xy.XYBarRenderer;
41import org.jfree.chart.renderer.xy.XYLineAndShapeRenderer;
42import org.jfree.data.category.DefaultCategoryDataset;
43import org.jfree.data.general.DefaultPieDataset;
44import org.jfree.data.time.Day;
45import org.jfree.data.time.TimeSeries;
46import org.jfree.ui.RectangleInsets;
47import org.jfree.ui.TextAnchor;
48
49/**
50 * Jfreechart工具类
51 * <p>
52 * 解决中午乱码问题<br>
53 * 用来创建类别图表数据集、创建饼图数据集、时间序列图数据集<br>
54 * 用来对柱状图、折线图、饼图、堆积柱状图、时间序列图的样式进行渲染<br>
55 * 设置X-Y坐标轴样式
56 * <p>
57 *
58 *
59 * @author chenchangwen
60 * @since:2014-2-18
61 *
62 */
63public class ChartUtils {
64	private static String NO_DATA_MSG = "数据加载失败";
65	private static Font FONT = new Font("宋体", Font.PLAIN, 12);
66	public static Color[] CHART_COLORS = {
67			new Color(31,129,188), new Color(92,92,97), new Color(144,237,125), new Color(255,188,117),
68			new Color(153,158,255), new Color(255,117,153), new Color(253,236,109), new Color(128,133,232),
69			new Color(158,90,102),new Color(255, 204, 102) };// 颜色
70
71	static {
72		setChartTheme();
73	}
74
75	public ChartUtils() {
76	}
77
78	/**
79	 * 中文主题样式 解决乱码
80	 */
81	public static void setChartTheme() {
82		// 设置中文主题样式 解决乱码
83		StandardChartTheme chartTheme = new StandardChartTheme("CN");
84		// 设置标题字体
85		chartTheme.setExtraLargeFont(FONT);
86		// 设置图例的字体
87		chartTheme.setRegularFont(FONT);
88		// 设置轴向的字体
89		chartTheme.setLargeFont(FONT);
90		chartTheme.setSmallFont(FONT);
91		chartTheme.setTitlePaint(new Color(51, 51, 51));
92		chartTheme.setSubtitlePaint(new Color(85, 85, 85));
93
94		chartTheme.setLegendBackgroundPaint(Color.WHITE);// 设置标注
95		chartTheme.setLegendItemPaint(Color.BLACK);//
96		chartTheme.setChartBackgroundPaint(Color.WHITE);
97		// 绘制颜色绘制颜色.轮廓供应商
98		// paintSequence,outlinePaintSequence,strokeSequence,outlineStrokeSequence,shapeSequence
99
100		Paint[] OUTLINE_PAINT_SEQUENCE = new Paint[] { Color.WHITE };
101		// 绘制器颜色源
102		DefaultDrawingSupplier drawingSupplier = new DefaultDrawingSupplier(CHART_COLORS, CHART_COLORS, OUTLINE_PAINT_SEQUENCE,
103				DefaultDrawingSupplier.DEFAULT_STROKE_SEQUENCE, DefaultDrawingSupplier.DEFAULT_OUTLINE_STROKE_SEQUENCE,
104				DefaultDrawingSupplier.DEFAULT_SHAPE_SEQUENCE);
105		chartTheme.setDrawingSupplier(drawingSupplier);
106
107		chartTheme.setPlotBackgroundPaint(Color.WHITE);// 绘制区域
108		chartTheme.setPlotOutlinePaint(Color.WHITE);// 绘制区域外边框
109		chartTheme.setLabelLinkPaint(new Color(8, 55, 114));// 链接标签颜色
110		chartTheme.setLabelLinkStyle(PieLabelLinkStyle.CUBIC_CURVE);
111
112		chartTheme.setAxisOffset(new RectangleInsets(5, 12, 5, 12));
113		chartTheme.setDomainGridlinePaint(new Color(192, 208, 224));// X坐标轴垂直网格颜色
114		chartTheme.setRangeGridlinePaint(new Color(192, 192, 192));// Y坐标轴水平网格颜色
115
116		chartTheme.setBaselinePaint(Color.WHITE);
117		chartTheme.setCrosshairPaint(Color.BLUE);// 不确定含义
118		chartTheme.setAxisLabelPaint(new Color(51, 51, 51));// 坐标轴标题文字颜色
119		chartTheme.setTickLabelPaint(new Color(67, 67, 72));// 刻度数字
120		chartTheme.setBarPainter(new StandardBarPainter());// 设置柱状图渲染
121		chartTheme.setXYBarPainter(new StandardXYBarPainter());// XYBar 渲染
122
123		chartTheme.setItemLabelPaint(Color.black);
124		chartTheme.setThermometerPaint(Color.white);// 温度计
125
126		ChartFactory.setChartTheme(chartTheme);
127	}
128
129	/**
130	 * 必须设置文本抗锯齿
131	 */
132	public static void setAntiAlias(JFreeChart chart) {
133		chart.setTextAntiAlias(false);
134
135	}
136
137	/**
138	 * 设置图例无边框,默认黑色边框
139	 */
140	public static void setLegendEmptyBorder(JFreeChart chart) {
141		chart.getLegend().setFrame(new BlockBorder(Color.WHITE));
142
143	}
144
145	/**
146	 * 创建类别数据集合
147	 */
148	public static DefaultCategoryDataset createDefaultCategoryDataset(Vector<Serie> series, String[] categories) {
149		DefaultCategoryDataset dataset = new DefaultCategoryDataset();
150
151		for (Serie serie : series) {
152			String name = serie.getName();
153			Vector<Object> data = serie.getData();
154			if (data != null && categories != null && data.size() == categories.length) {
155				for (int index = 0; index < data.size(); index++) {
156					String value = data.get(index) == null ? "" : data.get(index).toString();
157					if (isPercent(value)) {
158						value = value.substring(0, value.length() - 1);
159					}
160					if (isNumber(value)) {
161						dataset.setValue(Double.parseDouble(value), name, categories[index]);
162					}
163				}
164			}
165
166		}
167		return dataset;
168
169	}
170
171	/**
172	 * 创建饼图数据集合
173	 */
174	public static DefaultPieDataset createDefaultPieDataset(String[] categories, Object[] datas) {
175		DefaultPieDataset dataset = new DefaultPieDataset();
176		for (int i = 0; i < categories.length && categories != null; i++) {
177			String value = datas[i].toString();
178			if (isPercent(value)) {
179				value = value.substring(0, value.length() - 1);
180			}
181			if (isNumber(value)) {
182				dataset.setValue(categories[i], Double.valueOf(value));
183			}
184		}
185		return dataset;
186
187	}
188
189	/**
190	 * 创建时间序列数据
191	 *
192	 * @param category
193	 *            类别
194	 * @param dateValues
195	 *            日期-值 数组
196	 * @param xAxisTitle
197	 *            X坐标轴标题
198	 * @return
199	 */
200	public static TimeSeries createTimeseries(String category, Vector<Object[]> dateValues) {
201		TimeSeries timeseries = new TimeSeries(category);
202
203		if (dateValues != null) {
204			SimpleDateFormat dateFormat = new SimpleDateFormat("yyyy-MM-dd");
205			for (Object[] objects : dateValues) {
206				Date date = null;
207				try {
208					date = dateFormat.parse(objects[0].toString());
209				} catch (ParseException e) {
210				}
211				String sValue = objects[1].toString();
212				double dValue = 0;
213				if (date != null && isNumber(sValue)) {
214					dValue = Double.parseDouble(sValue);
215					timeseries.add(new Day(date), dValue);
216				}
217			}
218		}
219
220		return timeseries;
221	}
222
223	/**
224	 * 设置 折线图样式
225	 *
226	 * @param plot
227	 * @param isShowDataLabels
228	 *            是否显示数据标签 默认不显示节点形状
229	 */
230	public static void setLineRender(CategoryPlot plot, boolean isShowDataLabels) {
231		setLineRender(plot, isShowDataLabels, false);
232	}
233
234	/**
235	 * 设置折线图样式
236	 *
237	 * @param plot
238	 * @param isShowDataLabels
239	 *            是否显示数据标签
240	 */
241	public static void setLineRender(CategoryPlot plot, boolean isShowDataLabels, boolean isShapesVisible) {
242		plot.setNoDataMessage(NO_DATA_MSG);
243		plot.setInsets(new RectangleInsets(10, 10, 0, 10), false);
244		LineAndShapeRenderer renderer = (LineAndShapeRenderer) plot.getRenderer();
245
246		renderer.setStroke(new BasicStroke(1.5F));
247		if (isShowDataLabels) {
248			renderer.setBaseItemLabelsVisible(true);
249			renderer.setBaseItemLabelGenerator(new StandardCategoryItemLabelGenerator(StandardCategoryItemLabelGenerator.DEFAULT_LABEL_FORMAT_STRING,
250					NumberFormat.getInstance()));
251			renderer.setBasePositiveItemLabelPosition(new ItemLabelPosition(ItemLabelAnchor.OUTSIDE1, TextAnchor.BOTTOM_CENTER));// weizhi
252		}
253		renderer.setBaseShapesVisible(isShapesVisible);// 数据点绘制形状
254		setXAixs(plot);
255		setYAixs(plot);
256
257	}
258
259	/**
260	 * 设置时间序列图样式
261	 *
262	 * @param plot
263	 * @param isShowData
264	 *            是否显示数据
265	 * @param isShapesVisible
266	 *            是否显示数据节点形状
267	 */
268	public static void setTimeSeriesRender(Plot plot, boolean isShowData, boolean isShapesVisible) {
269
270		XYPlot xyplot = (XYPlot) plot;
271		xyplot.setNoDataMessage(NO_DATA_MSG);
272		xyplot.setInsets(new RectangleInsets(10, 10, 5, 10));
273
274		XYLineAndShapeRenderer xyRenderer = (XYLineAndShapeRenderer) xyplot.getRenderer();
275
276		xyRenderer.setBaseItemLabelGenerator(new StandardXYItemLabelGenerator());
277		xyRenderer.setBaseShapesVisible(false);
278		if (isShowData) {
279			xyRenderer.setBaseItemLabelsVisible(true);
280			xyRenderer.setBaseItemLabelGenerator(new StandardXYItemLabelGenerator());
281			xyRenderer.setBasePositiveItemLabelPosition(new ItemLabelPosition(ItemLabelAnchor.OUTSIDE1, TextAnchor.BOTTOM_CENTER));// weizhi
282		}
283		xyRenderer.setBaseShapesVisible(isShapesVisible);// 数据点绘制形状
284
285		DateAxis domainAxis = (DateAxis) xyplot.getDomainAxis();
286		domainAxis.setAutoTickUnitSelection(false);
287		DateTickUnit dateTickUnit = new DateTickUnit(DateTickUnitType.YEAR, 1, new SimpleDateFormat("yyyy-MM")); // 第二个参数是时间轴间距
288		domainAxis.setTickUnit(dateTickUnit);
289
290		StandardXYToolTipGenerator xyTooltipGenerator = new StandardXYToolTipGenerator("{1}:{2}", new SimpleDateFormat("yyyy-MM-dd"), new DecimalFormat("0"));
291		xyRenderer.setBaseToolTipGenerator(xyTooltipGenerator);
292
293		setXY_XAixs(xyplot);
294		setXY_YAixs(xyplot);
295
296	}
297
298	/**
299	 * 设置时间序列图样式 -默认不显示数据节点形状
300	 *
301	 * @param plot
302	 * @param isShowData
303	 *            是否显示数据
304	 */
305
306	public static void setTimeSeriesRender(Plot plot, boolean isShowData) {
307		setTimeSeriesRender(plot, isShowData, false);
308	}
309
310	/**
311	 * 设置时间序列图渲染:但是存在一个问题:如果timeseries里面的日期是按照天组织, 那么柱子的宽度会非常小,和直线一样粗细
312	 *
313	 * @param plot
314	 * @param isShowDataLabels
315	 */
316
317	public static void setTimeSeriesBarRender(Plot plot, boolean isShowDataLabels) {
318
319		XYPlot xyplot = (XYPlot) plot;
320		xyplot.setNoDataMessage(NO_DATA_MSG);
321
322		XYBarRenderer xyRenderer = new XYBarRenderer(0.1D);
323		xyRenderer.setBaseItemLabelGenerator(new StandardXYItemLabelGenerator());
324
325		if (isShowDataLabels) {
326			xyRenderer.setBaseItemLabelsVisible(true);
327			xyRenderer.setBaseItemLabelGenerator(new StandardXYItemLabelGenerator());
328		}
329
330		StandardXYToolTipGenerator xyTooltipGenerator = new StandardXYToolTipGenerator("{1}:{2}", new SimpleDateFormat("yyyy-MM-dd"), new DecimalFormat("0"));
331		xyRenderer.setBaseToolTipGenerator(xyTooltipGenerator);
332		setXY_XAixs(xyplot);
333		setXY_YAixs(xyplot);
334
335	}
336
337	/**
338	 * 设置柱状图渲染
339	 *
340	 * @param plot
341	 * @param isShowDataLabels
342	 */
343	public static void setBarRenderer(CategoryPlot plot, boolean isShowDataLabels) {
344
345		plot.setNoDataMessage(NO_DATA_MSG);
346		plot.setInsets(new RectangleInsets(10, 10, 5, 10));
347		BarRenderer renderer = (BarRenderer) plot.getRenderer();
348		renderer.setBaseItemLabelGenerator(new StandardCategoryItemLabelGenerator());
349		renderer.setMaximumBarWidth(0.075);// 设置柱子最大宽度
350
351		if (isShowDataLabels) {
352			renderer.setBaseItemLabelsVisible(true);
353		}
354
355		setXAixs(plot);
356		setYAixs(plot);
357	}
358
359	/**
360	 * 设置堆积柱状图渲染
361	 *
362	 * @param plot
363	 */
364
365	public static void setStackBarRender(CategoryPlot plot) {
366		plot.setNoDataMessage(NO_DATA_MSG);
367		plot.setInsets(new RectangleInsets(10, 10, 5, 10));
368		StackedBarRenderer renderer = (StackedBarRenderer) plot.getRenderer();
369		renderer.setBaseItemLabelGenerator(new StandardCategoryItemLabelGenerator());
370		plot.setRenderer(renderer);
371		setXAixs(plot);
372		setYAixs(plot);
373	}
374
375	/**
376	 * 设置类别图表(CategoryPlot) X坐标轴线条颜色和样式
377	 *
378	 * @param axis
379	 */
380	public static void setXAixs(CategoryPlot plot) {
381		Color lineColor = new Color(31, 121, 170);
382		plot.getDomainAxis().setAxisLinePaint(lineColor);// X坐标轴颜色
383		plot.getDomainAxis().setTickMarkPaint(lineColor);// X坐标轴标记|竖线颜色
384
385	}
386
387	/**
388	 * 设置类别图表(CategoryPlot) Y坐标轴线条颜色和样式 同时防止数据无法显示
389	 *
390	 * @param axis
391	 */
392	public static void setYAixs(CategoryPlot plot) {
393		Color lineColor = new Color(192, 208, 224);
394		ValueAxis axis = plot.getRangeAxis();
395		axis.setAxisLinePaint(lineColor);// Y坐标轴颜色
396		axis.setTickMarkPaint(lineColor);// Y坐标轴标记|竖线颜色
397		// 隐藏Y刻度
398		axis.setAxisLineVisible(false);
399		axis.setTickMarksVisible(false);
400		// Y轴网格线条
401		plot.setRangeGridlinePaint(new Color(192, 192, 192));
402		plot.setRangeGridlineStroke(new BasicStroke(1));
403
404		plot.getRangeAxis().setUpperMargin(0.1);// 设置顶部Y坐标轴间距,防止数据无法显示
405		plot.getRangeAxis().setLowerMargin(0.1);// 设置底部Y坐标轴间距
406
407	}
408
409	/**
410	 * 设置XY图表(XYPlot) X坐标轴线条颜色和样式
411	 *
412	 * @param axis
413	 */
414	public static void setXY_XAixs(XYPlot plot) {
415		Color lineColor = new Color(31, 121, 170);
416		plot.getDomainAxis().setAxisLinePaint(lineColor);// X坐标轴颜色
417		plot.getDomainAxis().setTickMarkPaint(lineColor);// X坐标轴标记|竖线颜色
418
419	}
420
421	/**
422	 * 设置XY图表(XYPlot) Y坐标轴线条颜色和样式 同时防止数据无法显示
423	 *
424	 * @param axis
425	 */
426	public static void setXY_YAixs(XYPlot plot) {
427		Color lineColor = new Color(192, 208, 224);
428		ValueAxis axis = plot.getRangeAxis();
429		axis.setAxisLinePaint(lineColor);// X坐标轴颜色
430		axis.setTickMarkPaint(lineColor);// X坐标轴标记|竖线颜色
431		// 隐藏Y刻度
432		axis.setAxisLineVisible(false);
433		axis.setTickMarksVisible(false);
434		// Y轴网格线条
435		plot.setRangeGridlinePaint(new Color(192, 192, 192));
436		plot.setRangeGridlineStroke(new BasicStroke(1));
437		plot.setDomainGridlinesVisible(false);
438
439		plot.getRangeAxis().setUpperMargin(0.12);// 设置顶部Y坐标轴间距,防止数据无法显示
440		plot.getRangeAxis().setLowerMargin(0.12);// 设置底部Y坐标轴间距
441
442	}
443
444	/**
445	 * 设置饼状图渲染
446	 */
447	public static void setPieRender(Plot plot) {
448
449		plot.setNoDataMessage(NO_DATA_MSG);
450		plot.setInsets(new RectangleInsets(10, 10, 5, 10));
451		PiePlot piePlot = (PiePlot) plot;
452		piePlot.setInsets(new RectangleInsets(0, 0, 0, 0));
453		piePlot.setCircular(true);// 圆形
454
455		// piePlot.setSimpleLabels(true);// 简单标签
456		piePlot.setLabelGap(0.01);
457		piePlot.setInteriorGap(0.05D);
458		piePlot.setLegendItemShape(new Rectangle(10, 10));// 图例形状
459		piePlot.setIgnoreNullValues(true);
460		piePlot.setLabelBackgroundPaint(null);// 去掉背景色
461		piePlot.setLabelShadowPaint(null);// 去掉阴影
462		piePlot.setLabelOutlinePaint(null);// 去掉边框
463		piePlot.setShadowPaint(null);
464		// 0:category 1:value:2 :percentage
465		piePlot.setLabelGenerator(new StandardPieSectionLabelGenerator("{0}:{2}"));// 显示标签数据
466	}
467
468	/**
469	 * 是不是一个%形式的百分比
470	 *
471	 * @param str
472	 * @return
473	 */
474	public static boolean isPercent(String str) {
475		return str != null ? str.endsWith("%") && isNumber(str.substring(0, str.length() - 1)) : false;
476	}
477
478	/**
479	 * 是不是一个数字
480	 *
481	 * @param str
482	 * @return
483	 */
484	public static boolean isNumber(String str) {
485		return str != null ? str.matches("^[-+]?(([0-9]+)((([.]{0})([0-9]*))|(([.]{1})([0-9]+))))$") : false;
486	}
487
488}
Serie
1package util;
2
3import java.io.Serializable;
4import java.util.Vector;
5
6/**
7 * 系列:名字和数据集合 构成一条曲线</br> 可以将serie看作一根线或者一根柱子:
8 *
9 * <p>
10 * 参照JS图表来描述数据:</br> series: [{ name: 'Tokyo', data: [7.0, 6.9, 9.5, 14.5]
11 * },</br> { name: 'New York', data: [-0.2, 0.8, 5.7, 11.3} ]</br>
12 * </p>
13 *
14 * @author ccw
15 * @date 2014-6-4
16 */
17public class Serie implements Serializable {
18
19	private static final long serialVersionUID = 1L;
20	private String name;// 名字
21	private Vector<Object> data;// 数据值
22
23	public Serie() {
24
25	}
26
27	/**
28	 *
29	 * @param name
30	 *            名称(线条名称)
31	 * @param data
32	 *            数据(线条上的所有数据值)
33	 */
34	public Serie(String name, Vector<Object> data) {
35
36		this.name = name;
37		this.data = data;
38	}
39
40	/**
41	 *
42	 * @param name
43	 *            名称(线条名称)
44	 * @param array
45	 *            数据(线条上的所有数据值)
46	 */
47	public Serie(String name, Object[] array) {
48		this.name = name;
49		if (array != null) {
50			data = new Vector<Object>(array.length);
51			for (int i = 0; i < array.length; i++) {
52				data.add(array[i]);
53			}
54		}
55	}
56
57	public String getName() {
58		return name;
59	}
60
61	public void setName(String name) {
62		this.name = name;
63	}
64
65	public Vector<Object> getData() {
66		return data;
67	}
68
69	public void setData(Vector<Object> data) {
70		this.data = data;
71	}
72
73}
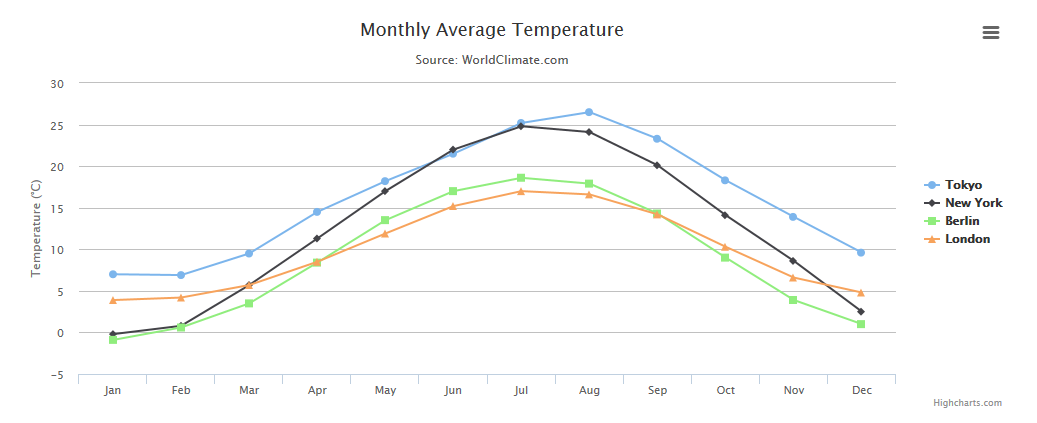
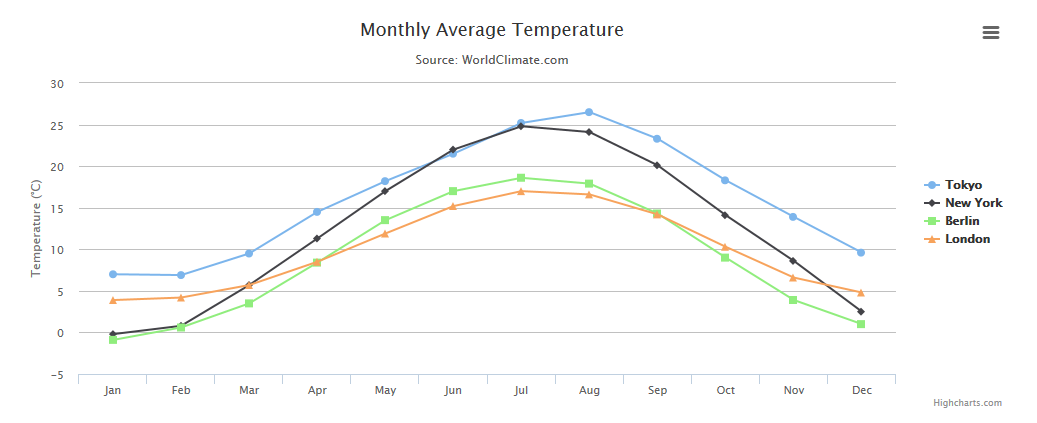
在来看看Highchart图表,对比一下,有木有觉得很像啊!
有木有觉得swing和Java2D很强大啊,学好swing,需要想象力!